![[OLD – FALL 2016] 15-104 • COMPUTING for CREATIVE PRACTICE](https://courses.ideate.cmu.edu/15-104/f2016/wp-content/uploads/2020/08/stop-banner.png)
Vortex – Rachel Binx – March 2015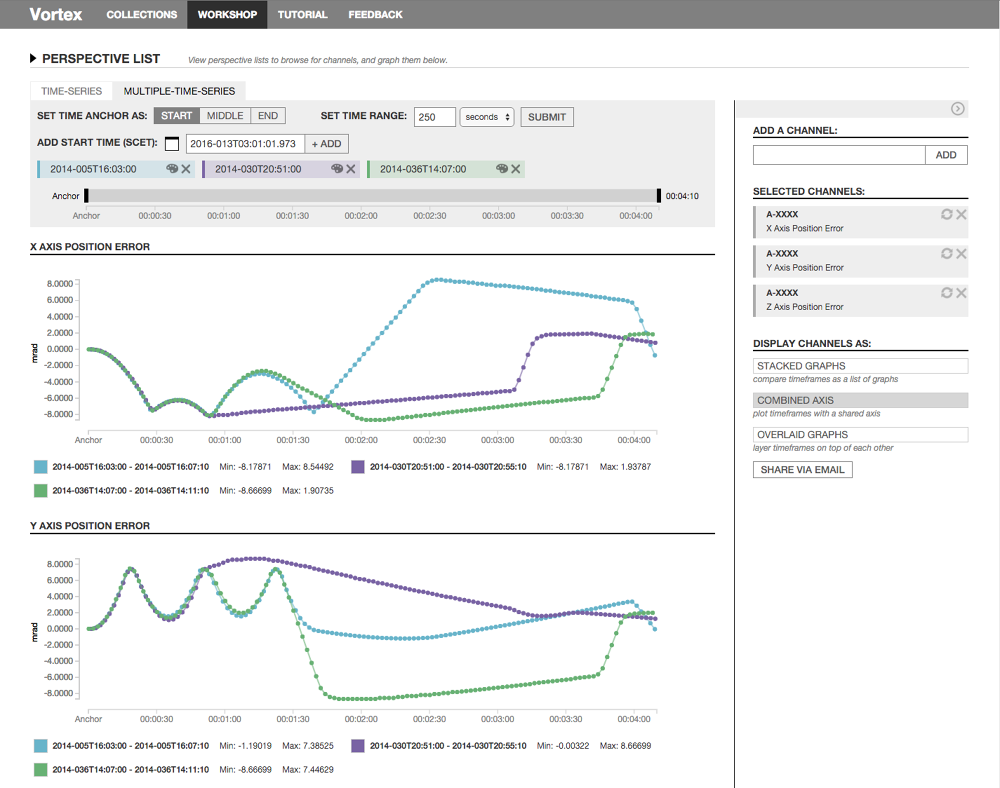
Plotting channels of points as combined axis

Plotting channels of points as stacked graphs
I really appreciated the pragmatism of this project. Often times visualization programs end up too focused on making the visualization interesting and nice to look at that functionality can be forgotten. This created a healthy mix between the two in my opinion by presenting the data in both a enjoyable way, but also in a way that makes it easy to extrapolate and understand.
The author also describes how she created the program, using React and d3.js. It takes in datasets which are decoded depending on their datatypes. Outside of that it allows custom colors and display choices depending on user preference.