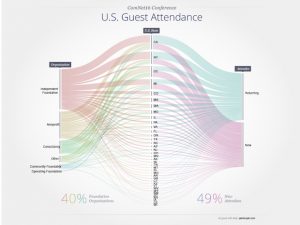
Periscopic, a Data Visualization firm, collected list of attendees of the 2016 Communications Network Conference in Detroit and built upon the data to help visualize the relationships between the attendees in hope to evoke a sense of connection in an event of network. I find this project very interesting because of their diagrammatic representation of the data. In the article that Periscopic provided, they describe steps they took in creating this interactive data which relates strongly with developing architectural diagrams (since I major in Architecture). Narrowing down dataset to articulate relationships they want to highlight, they included design aesthetic, color, and context that resulted in clear, interactive visualization. One special approach they took in collecting this data is that they asked the attendees to identify themselves in an open-ended question, expanding the categories. Through this graphical representation, Periscopic reveal the volume of multiple categories showing flow both visually and in context.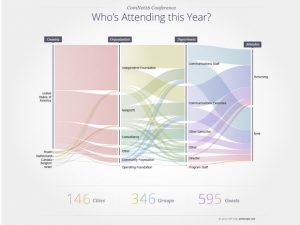
Skip to content
![[OLD – FALL 2016] 15-104 • COMPUTING for CREATIVE PRACTICE](https://courses.ideate.cmu.edu/15-104/f2016/wp-content/uploads/2020/08/stop-banner.png)
[OLD – FALL 2016] 15-104 • COMPUTING for CREATIVE PRACTICE
Professor Roger B. Dannenberg • Fall 2016 • Introduction to Computing for Creative Practice