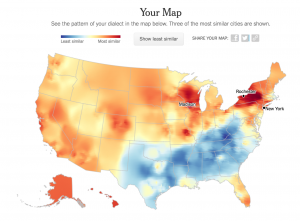
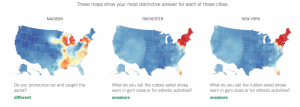
When I found out this week’s “Looking Outwards” topic was computational informational visualization, I immediately thought of a quiz I took a couple weeks ago from the New York Times. The quiz, titled “How Y’all, Youse, and You Guys Talk” asks participants 25 questions about how they speak. The quiz results are a personal dialect map, which shows three locations in the U.S. that are most similar to one’s dialect and also locations that are most dissimilar (red maps most similar, while blue maps most dissimilar).


The data for the quiz and maps comes from 350,000+ survey responses collected from August to October 2013 by Josh Katz, a graphics editor for the New York Times who developed the quiz. Many of the questions in the quiz are based on those in the Harvard Dialect Survey, a linguistics project begun in 2002 by Bert Vaux and Scott Golder.
I find this project really interesting not only because it was extremely accurate in pinpointing my home city (I’m from Upstate New York) but also because Katz just did a fantastic job with it. While I definitely don’t know exactly how this work was generated computationally, I would imagine there is some kind of combination of research/statistics/probability and more complex forms of “if/then” statements to construct the location heat maps. I also like it because it puts data in a way that is extremely easy to understand visually.
You can take the quiz here and see for yourself if it’s accurate!
![[OLD – FALL 2016] 15-104 • COMPUTING for CREATIVE PRACTICE](https://courses.ideate.cmu.edu/15-104/f2016/wp-content/uploads/2020/08/stop-banner.png)