![[OLD – FALL 2016] 15-104 • COMPUTING for CREATIVE PRACTICE](https://courses.ideate.cmu.edu/15-104/f2016/wp-content/uploads/2020/08/stop-banner.png)
Response to Mairead Dambruch’s Looking Outwards 07:
https://courses.ideate.cmu.edu/15-104/f2016/2016/10/13/looking-outwards-07-mdambruc-informationvisualization/
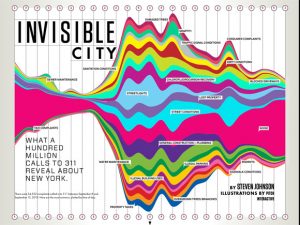
Pitch Interactive’s “Invisible City” 2010
http://pitchinteractive.com/work/Wired311.html
I think this graphic is really interesting. Mairead wrote this Looking Outwards for the information visualization Looking Outwards, and I really enjoy how this information was represented. The artist compiled information about types of phone call complaints, as well as what time the phone calls were made. As Mairead said, the loud colors and extreme waves of the graphic captures the irritable nature of the people calling to complain. I enjoy the clock icons to depict time of day, but the icons are so small that it was sometimes hard to locate what time of day was where.
I also found it funny to see exactly what kind of complaints are most common — New Yorkers apparently have a noise problem! It’s interesting to see how the noise wave progresses over time, and how large the wave becomes later in the day. The biggest amount of complaints are made during the middle of the day, but considerable complaints are still made late into the night. I think this graphic is effective in representing the volume of these complaint calls, and is a creative way of visualizing categories of complaints.