Andrew Wang – Project 07

sketch

//Andrew Wang

function setup() {
    createCanvas(400, 400);
    fill(240,210,210);
}

function draw() {
    background(130);
    push();
    translate(width/2, height/2);
    //maps mouse between 0- 150 (0-75 for inner) and rotates grid by 30 degrees
    x = map(mouseX, 0, width, 0, 150);
    y = map(mouseY, 0, height, 0, 150);
    rotate(radians(30));
    cruciform(x,y);
    x = map(mouseX, 0, width,150,0);
    y = map(mouseY, 0, height, 150, 0);
    rotate(radians(30));
    cruciform(x,y)
    x = map(mouseX, 0, width, 75,0);
    y = map(mouseY, 0, height, 75,0);
    rotate(radians(30));
    cruciform(y,x);
    x = map(mouseX, 0, width, 0, 150);
    y = map(mouseY, 0, height, 0, 150);
    rotate(radians(30));
    cruciform(x,y);
    x = map(mouseX, 0, width,150,0);
    y = map(mouseY, 0, height, 150, 0);
    rotate(radians(30));
    cruciform(x,y)
    pop();
}

function cruciform(a,b){
    beginShape();
    noStroke();
    for (var n = 0; n < 100; n++) {
        //change to degrees
        var t = map(n, 0, 100, 0, 2*PI)
        //parametric equation of cruciform
        x = a*(1/cos(t));
        y = b*(1/sin(t));
        //draws circles of size 3-6
        ellipse(x, y, map(mouseY, 0, height, 3, 6), 
                      map(mouseY, 0, height, 3, 6));
    }
    endShape(CLOSE);
}

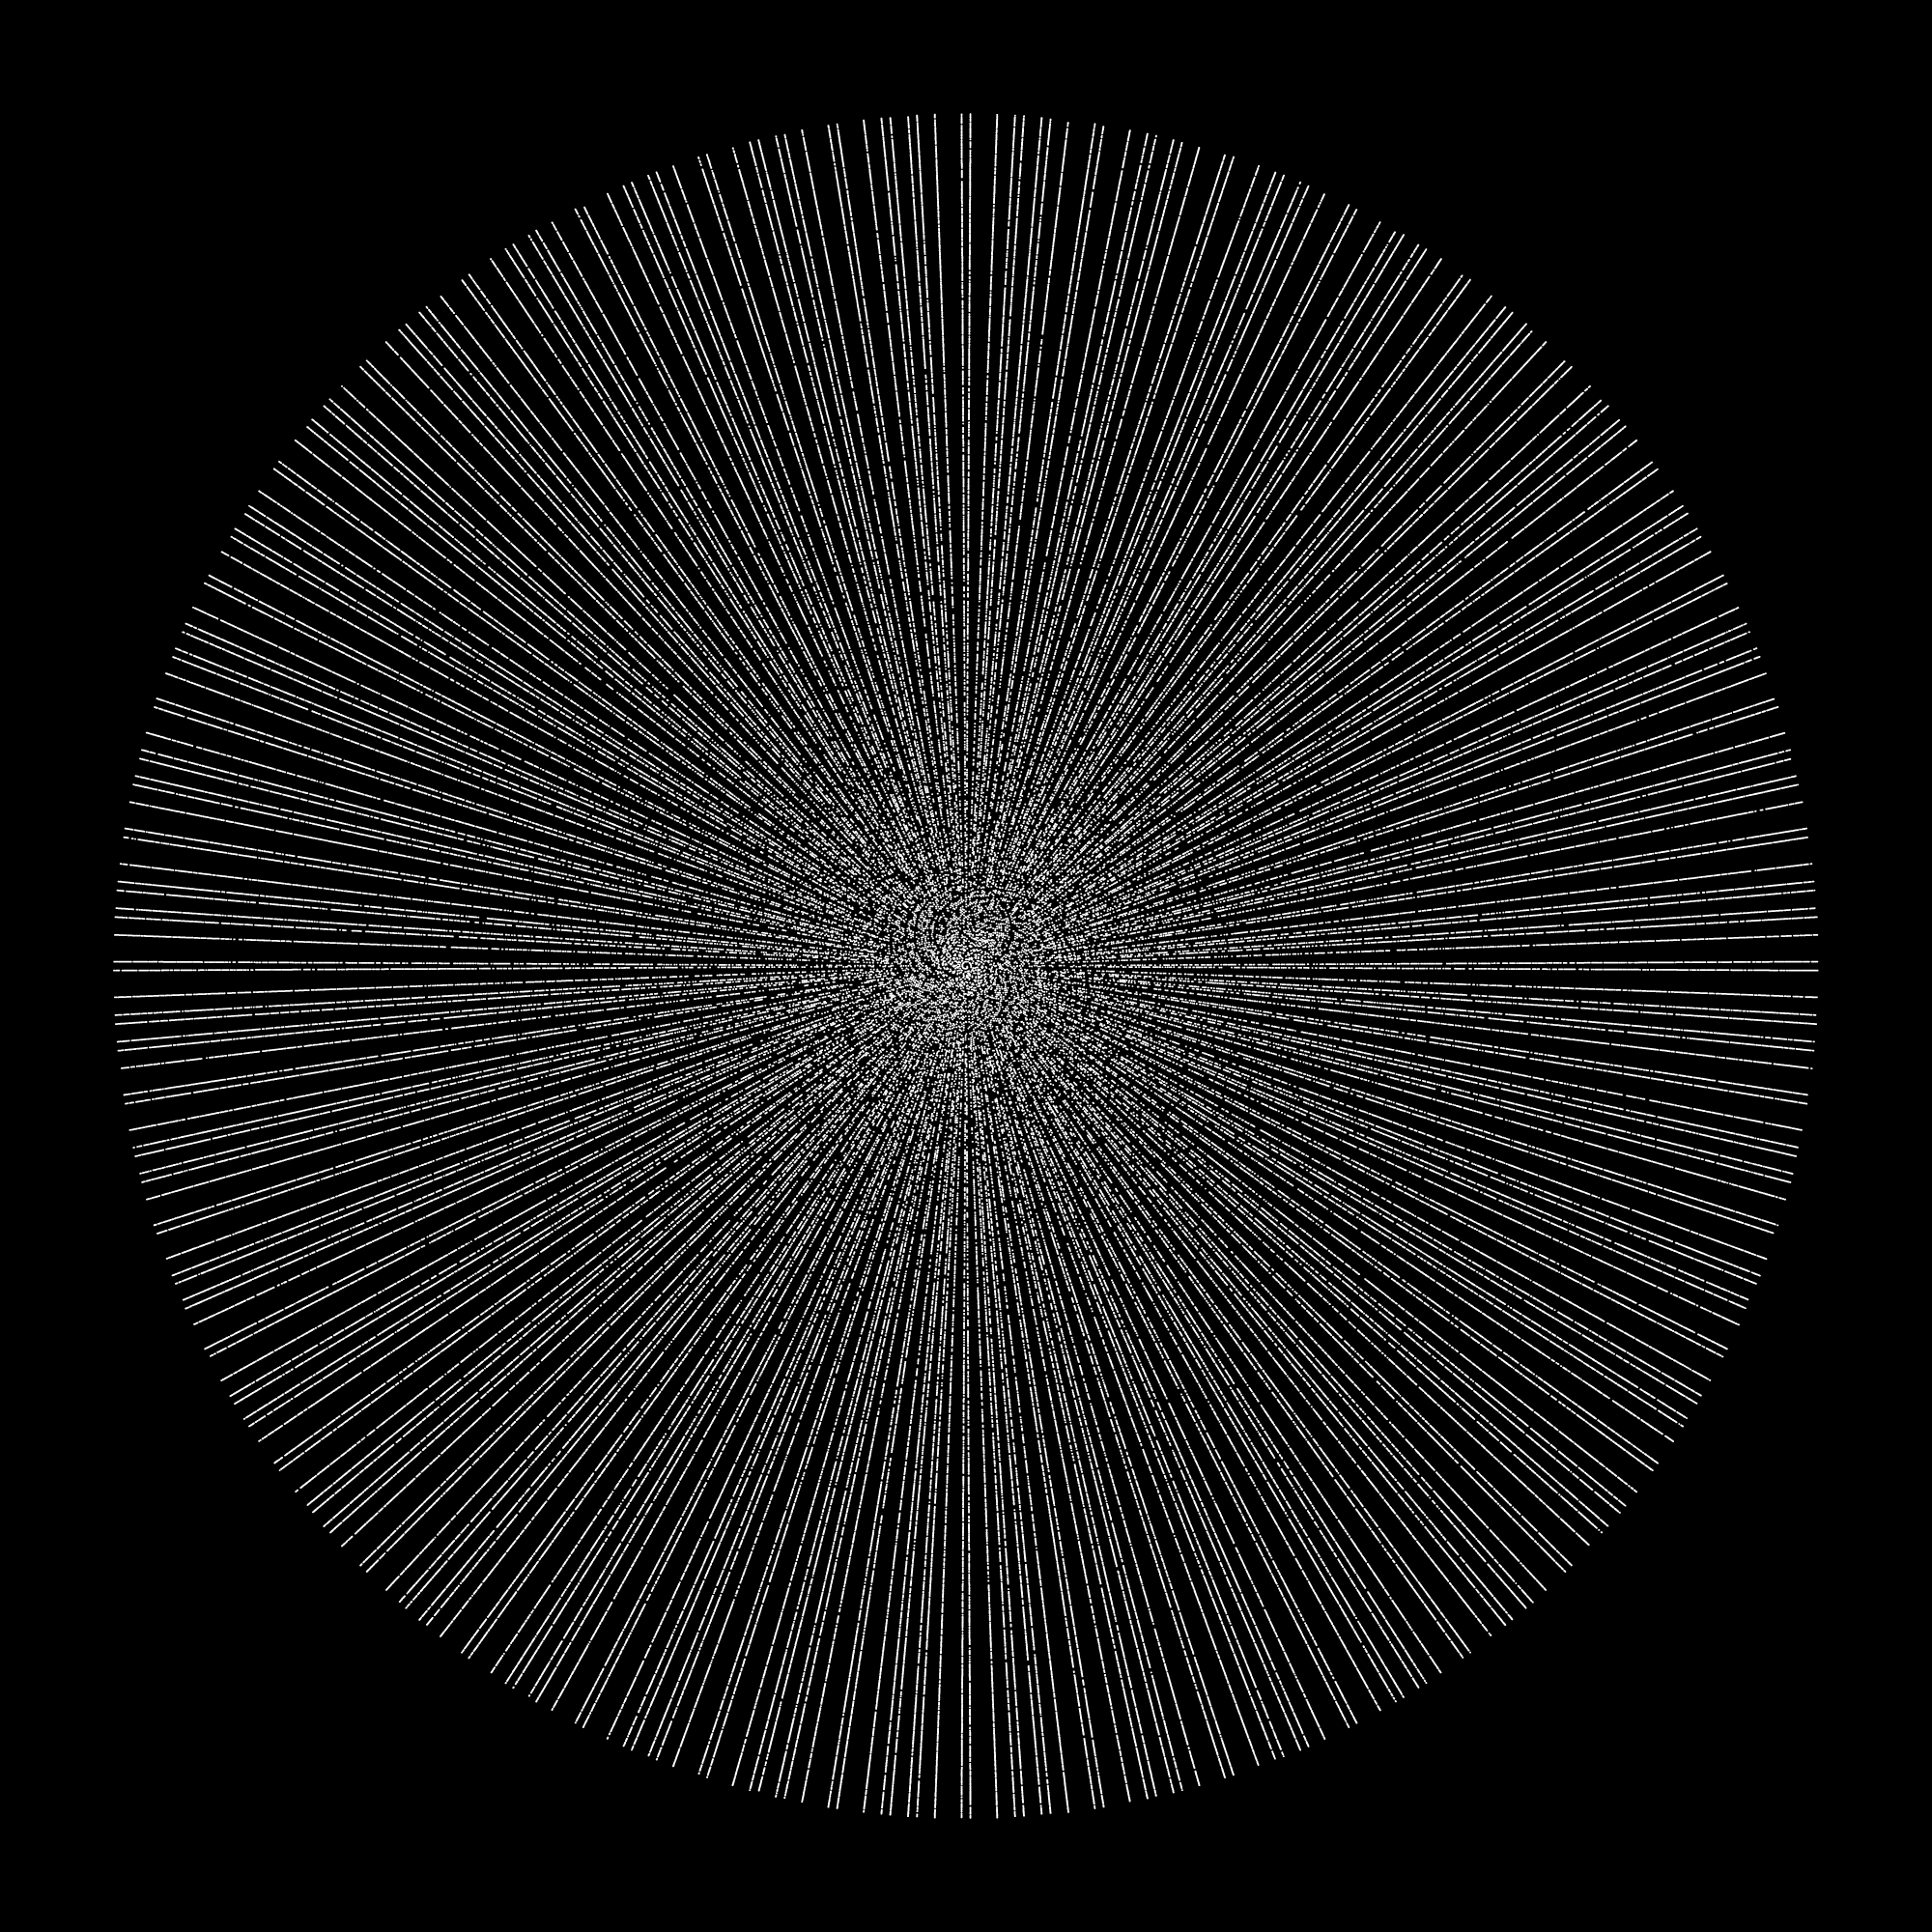
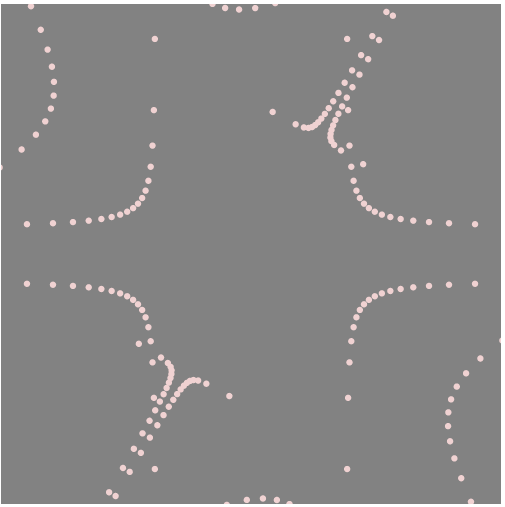
I used the cruciform curve from mathworld for my project. Initially having only put down one curve, it looked a bit lackluster so I created a smaller version to sit inside of the larger one. This was a little better, however, it still looked a little bit barren at certain mouse positions so I decided to try rotations.

v1

I realized that if I wanted to rotate, I would have to make four outer cruciform curves to fill each of the corners. I made the one in the middle upright and curved the others.

v2

for this curve, the two equations that I used were x = a*1/cos(t) and y= a*1/sin(t). I plotted points along the curve instead of drawing the lines since it looked a little bit strange with the lines as there were lots of intersections.

Looking Outwards 07

Vortex – Rachel Binx – March 2015vortex_power_curves_1000

Plotting channels of points as combined axis

vortex_wake_periods_1000

Plotting channels of points as stacked graphs


I really appreciated the pragmatism of this project. Often times visualization programs end up too focused on making the visualization interesting and nice to look at that functionality can be forgotten. This created a healthy mix between the two in my opinion by presenting the data in both a enjoyable way, but also in a way that makes it easy to extrapolate and understand.

The author also describes how she created the program, using React and d3.js. It takes in datasets which are decoded depending on their datatypes. Outside of that it allows custom colors and display choices depending on user preference.


Project 06

sketch

function setup() {
  createCanvas(500, 500);
  //sets up initial variables
  diameter = width/1.2;
  noStroke();
}

function draw() {
  background(155);
  //draws clock face
  fill(0);
  ellipse(width/2, height/1.85, diameter, diameter);
  //gets s,m,h within the circle
  s = second()*(TWO_PI/60);
  m = minute()*(TWO_PI/60); 
  h = hour()*(TWO_PI/12);
  drawHands();
  displayText();
  ticks();
}
  
function drawHands(){
  fill(225);
  //seconds
  arc(width/2, height/1.85, diameter, diameter,radians(270), 
     radians(270)+s);
  strokeWeight(5);
  //minutes
  noStroke();
  fill(155);
  arc(width/2, height/1.85, diameter*0.6, diameter*0.6, radians(270),
      radians(270)+m);
  strokeWeight(10);
  //hours
  fill(50);
  arc(width/2, height/1.85, diameter*0.3, diameter*0.3,  radians(270),
      radians(270)+h);
}

function displayText(){
  //draws text
  textAlign(CENTER);
  textSize(24);
  fill(255);
  noStroke();
  clockText = nf(hour(),2,0)+":"+nf(minute(),2,0)+":"+nf(second(),2,0);
  text(clockText, width/2 , 45);
}

function ticks(){
  //draws clock ticks
  strokeWeight(5);
  stroke(255);
  for (var angle = 0; angle < 360; angle+=6) {
    var x = width/2 + cos(radians(angle)) * width/2.4;
    var y = height/1.85 + sin(radians(angle)) * width/2.4;
    ellipse(x, y, 1, 1);
  }
}

I decided to try and do a variation of a normal clock by making its ticks add onto each other until it loops at the top again. I tried to make the colors compliment each other and having the second hand and the hour hand stand out more than the minute hand. I did this by creating three arcs on top of each other that incremented based on the minute, hour, and second functions. I also added round ticks at at intervals of 6 degrees to help better visualize the exact time. sketch2

Looking Outwards 06

Silk – Weave Silk Studios (creator and project details aren’t specified)

Example Use –

This isn’t so much an art project but rather a project for other people to create their own generative art. The user uses their mouse to specify points along the grid, and the program generates smooth lines randomly from that point onwards. Although it’s not the creators own artwork, I still think it shows their creativity and artistic style, as well as the computation, randomness, and creativity required for this weeks looking outwards post. I really respect that it gives everyone the chance to try their hand at generative art, and hope that more tools like this are available!

Project-05-Wallpaper

sketch

function setup() {
	createCanvas(400,200);
}

function draw() {
    background(255,228,196);
    var tw = 30;
    var th = 30;
    var oy = 0;
    var ox = 0;
    var rows = 3*height/30;
    //draws a staggered circle pattern
    for (var y = 0; y < rows; y++) {
        if (y%2 == 0){
            var cols = width/30;
        }else{
            var cols = width/30-1;
        }
        //changes behavior based on which row it's on
        for (var x = -1; x < cols+1; x++) {
            if (cols == width/30){
                var py = oy + y / 2 * th;
                var px = ox + x * tw;
                fill(222);
                ellipse(px, py, 5, 5);
                drawSquare(px, py);
                zigZag(px,py,1);
                zigZag(px,py,0);
            }else{
                var py = oy + y / 2 * th;
                var px = ox + x * tw + tw/2;
                fill(135);
                ellipse(px, py, 5, 5);
                drawSquare(px, py);
                zigZag(px,py,0);
            }
        }
    }
    noLoop();
}
// draws squares
function drawSquare(x,y){
    rectMode(CENTER);
    fill(123,213,132);
    rect(x+15, y, 5, 5);
}

function zigZag(x,y,mode){
    x-=2;
    y-=1;
    var a = x;
    var b = y;
    //draws zig zagging lines
    for (var n = 0; n<15; n++){
        if (n%2==0){
            x+=2;
            line(a, b, x, y);
            a = x;
        }else{
            //draws lines going left
            if (mode == 1){
                y+=2;
                line(a, b, x, y);
                b = y;
            //draws lines going right
            }else {
                y-=2;
                line(a, b, x, y);
                b = y;
            }
        }
    }
}

I created an alternating grid of circles with rectangles filling the spaces in between. I then created a function that created zig zagging lines to link together the circles in a rectangular way. I tried connecting the circles so that they are somewhat hidden by the lines even though their shapes are still visible so that the attention is drawn onto the brighter colored squares that stand out in the center of the peach background.

LookingOutwards-05

Krzysztof Marczak

This was created by iterating many satellite structures to create a fragmented surface texture as a Mandelbulb piece. I really liked this piece as it seemed to have a lot of depth to it even though it was generated by an algorithm. You can also clearly see the artist’s intentions through this piece, and also visualize what he was trying to create. I think it’s really unique when an artist is able to make something so identifiable with such a vague concept.

String Art Week 4

sketch

function setup() {
	createCanvas(640,480);
}
var endPoint = 304;
function draw() {
  background(0);
  for (var i = -100; i <= 300; i += 3){
      if (mouseIsPressed){
        stroke(76);
        // left inner curves displayed on mouse press
        line(i, height/2, width/2.1, height/2.5 + i);
        line(i, height/2, width/2.1, height/1.55 - i);
      }
      stroke(76);
      //left outer lines
      line(i, height/2, endPoint, height);
      stroke(220);
      line(i, height/2, endPoint, 0);
  }
  for (var i = 700; i >= 300; i -= 3){
      stroke(232);
      //right inner curves
      line(i, height/2, width/2.1, -height/1.55+i);
      line(i, height/2, width/2.1, height*1.65-i);
      stroke(13);
      //right outer lines
      line(i, height/2, endPoint, height);
      line(i, height/2, endPoint, 0);
  }
}
//fun function
function mouseIsPressed() {
    console.log(5);
    for (var i = -100; i <= 300; i += 3){

    }

}

I drew 4 curves first to represent the inner diamond shaped figure. I then encased it with other iterated lines and added a fun function to change the shape on mouse click.

edit: The picture wasn’t meant to fit within the dimensions given

Andrew-LookingOutwards-2

Wheel of Primes – Mario Klingemann

Wheel of Prime

This project was created to demonstrate a new type of visualization involving Prime Numbers and their positioning on linear rays when the natural numbers are aligned along a Fermat spiral. I thought that this was inspirational through its demonstration of how a key mathematic principle can be boiled down to something so orderly and beautiful at such a large scale even if it’s hard to comprehend at a molecular level. I think the author was able to convey his artistic sensibilities through this display as he mentioned that he did not come across anything like it before, showing not only his creativity in finding this pattern, but also in expressing it. The artist actually included part of the algorithm in the blog and explained the process he went about to create it. But for the ret of the algorithm, I believe he took the numbers generated from the initial algorithm and just formatted them alongside the circle.

Looking Outwards 04

I really liked this display of music through the use of both repeating and unique algorithms that harmonize together in a real world fashion. Everything was controlled by the computer’s MIDI signal and was converted into either mechanical or electronic sounds. I really respect the amount of time and effort that must have gone into making this ensemble, and the author’s own creativity was really shown through the complexity and scale of this project. It introduced a new form of sound generation to me, and I think that it is an interesting and fascinating way to produce new music. I’ll definitely be keeping an eye out for more in the future!

Category Project-03-Dynamic-Drawing

var bgR = 255;
var bgG = 0;
var bgB = 127.5;
var rad = 20;

function setup() {
    createCanvas(640, 480);
    rectMode(CENTER);
}

function draw() {
    background(0);
    fill(255);
    // restrict mouseX to 0-400
    var m = max(min(mouseX, 540), 100);
    changes(m);
    //rotates rectangle according to mouseX position
    push();
    translate(width/2,height/2);
    rotate(radians((mouseX/2)%180));
    rect(0, 0, 50,50);
    pop();
    //creates two ellipses whose size/color/position are based on mouseX position
    fill(bgR, bgG, bgB);
    ellipse(m, 100,rad, rad);
    ellipse(width-m, 380, rad, rad);
}

function changes(x){
	var unit = 255/600.00
	//color changes based on mouseX and mouseY
	bgR = 255-unit*mouseY;
	bgB = 0 + unit*mouseX;
	if (x <= 300) {
		bgG = 127.5+unit*mouseY;
	}else {
		bgG = 127.5-unit*mouseY;
	}
	//radius of ellipses changes based on mouseX position
	rad = mouseX/8;
}