Final Project

C-major Palette

/*Emma Shi
eyshi@andrew.cmu.edu
Section B
Final Project
*/

var midC;
var D;
var E;
var F;
var G;
var A;
var B;
var hiC;
var pad = 38;
var space = 75;
var col = 0;
var thickness = 1;
var rD = 7;
var gD = 80;
var bD = 6;
var rE = 243;
var gE = 170;
var bE = 0;
var rF = 83;
var gF = 38;
var bF = 0;
var rA = 256;
var gA = 246;
var bA = 227;
var rB = 46;
var gB = 39;
var bB = 118;
var eraser;

function preload(){
  A = loadSound('https://courses.ideate.cmu.edu/15-104/f2016/wp-content/uploads/2016/12/A.mp3');
  B = loadSound('https://courses.ideate.cmu.edu/15-104/f2016/wp-content/uploads/2016/12/B.mp3');
  midC = loadSound('https://courses.ideate.cmu.edu/15-104/f2016/wp-content/uploads/2016/12/middleC.mp3');
  hiC = loadSound('https://courses.ideate.cmu.edu/15-104/f2016/wp-content/uploads/2016/12/highC.mp3');
  D = loadSound('https://courses.ideate.cmu.edu/15-104/f2016/wp-content/uploads/2016/12/D.mp3');
  E = loadSound('https://courses.ideate.cmu.edu/15-104/f2016/wp-content/uploads/2016/12/E.mp3');
  F = loadSound('https://courses.ideate.cmu.edu/15-104/f2016/wp-content/uploads/2016/12/F.mp3');
  G = loadSound('https://courses.ideate.cmu.edu/15-104/f2016/wp-content/uploads/2016/12/G.mp3');
}
function setup(){
  createCanvas(800, 300);
  background(0);
}

function draw(){
  noStroke();
  middleC();
  noteD();
  noteE();
  noteF();
  noteG();
  noteA();
  noteB();
  highC();
  paint();
  eraser = createEraser();

if (mouseIsPressed) {
  if ((10 <= mouseX) & (mouseX <= 70) && (8 <= mouseY) && (mouseY <= 70)){
  col = "red";//if user presses mouse within the upper right red circle, the stroke is red
  midC.play();
} else if ((10 <= mouseX) & (mouseX <= 70) && (80 <= mouseY) && (mouseY <= 142)){
  col = color(rE, gE, bE);//if user presses mouse within the mid right yellow circle, the stroke is yellow
  E.play();
} else if ((10 <= mouseX) & (mouseX <= 70) && (155 <= mouseY) && (mouseY <= 220)){
  col = "white";//if user presses mouse within the mid right white circle, the stroke is white 
  G.play();
} else if((10 <= mouseX) & (mouseX <= 70) && (230 <= mouseY) && (mouseY <= height-8)){
  col = color(rB, gB, bB);//if user presses mouse within the bottom right blue circle, the stroke is blue
  B.play();
} else if ((80 <= mouseX) & (mouseX <= 140) && (8 <= mouseY) && (mouseY <= 70)){
  col = color(rD, gD, bD);//if user presses mouse within the upper left green circle, the stroke is green
  D.play();
} else if ((80 <= mouseX) & (mouseX <= 140) && (80 <= mouseY) && (mouseY <= 142)){
  col = color(rF, gF, bF);//if user presses mouse within the mid left brown circle, the stroke is brown
  F.play();
} else if ((80 <= mouseX) & (mouseX <= 140) && (155 <= mouseY) && (mouseY <= 220)){
  col = color(rA, gA, bA);//if user presses mouse within the mid left beige circle, the stroke is beige
  A.play();
} else if ((80 <= mouseX) & (mouseX <= 140) && (230 <= mouseY) && (mouseY <= height-8)){
  col = "red";//if user presses mouse within the bottom left red circle, the stroke is red
  hiC.play();
} else if ((120 <= mouseX) & (mouseX >= 160) && (50 <= mouseY) && (mouseY <= 70)){
  col = 0;
}
  push();
  stroke(col);
  strokeWeight(thickness);
  line(pmouseX, pmouseY, mouseX, mouseY);
  pop();
}

  fill("white");
  textStyle(NORMAL);
  text('Click on a circle and drag your cursor to draw', 160, 20);
  text('Press A to increase brush size', 160, 32);
  text('Press B to decrease brush size', 160, 44);
}

function middleC(){
  fill("red");
  ellipse(40, pad, 60, 60);//upper right red circle
}

function noteD(){
  fill(rD, gD, bD);
  ellipse(110, pad, 60, 60);//upper left green circle
}

function noteE(){
  fill(rE, gE, bE);
  ellipse(40, pad + space, 60, 60);//mid right yellow circle
}

function noteF(){
  fill(rF, gF, bF);
  ellipse(110, pad + space, 60, 60);//mid left brown circle
}

function noteG(){
  fill("white");
  ellipse(40, pad + 2*space, 60, 60);//mid right white circle
}

function noteA(){
  fill(rA, gA, bA);
  ellipse(110, pad + 2*space, 60, 60);//mid left off-white circle
}

function noteB(){
  fill(rB, gB, bB);
  ellipse(40, height-pad, 60, 60);//bottom right blue-violet circle
}

function highC(){
  fill("red")
  ellipse(110, height-pad, 60, 60);//bottom left red circle
}

function paint(){
  line(pmouseX, pmouseY, mouseX, mouseY);//allows user to draw
}

function createEraser() {
  noFill();
  stroke("white");
  rect(160, 50, 40, 20);

  noFill();
  text('Erase', 165, 65);//creates Erase button
}

function keyTyped(){
  if (key == 'a'){
    thickness += 0.5;//strokeweight increases by 0.5 if user presses a
  } else if (key == 'b'){
    thickness -= 0.5;//strokeweight decreases by 0.5 is user presses b
  }
}

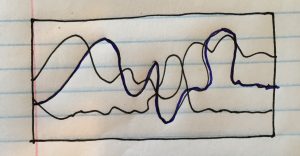
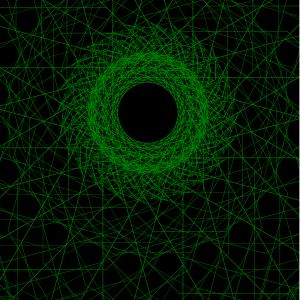
I originally wanted to create a program that would essentially create a “music video” for a song, and have notes in the song represented through colors that I associate with specific notes (I have perfect pitch, and perhaps as a result, synesthesia with music notes and color). However, I ended up making a different project in the end, but still wanted to incorporate audiovisual elements that reflect my own experiences in having synesthesia and perfect pitch.

In essence, this project is a simple drawing tool where there is a given color palette; specifically, one that represents the C-major scale for me. Each color in the palette references a different note — D is represented by dark green, E is represented by mustard yellow, F is represented by brown, G is represented by white, A is represented by off-white, B is represented by blue-violet, and you may notice that middle C and high C are represented by the same red color (I don’t make a distinction in color between the same note in different octaves). Every time the user draws, the corresponding note is played.

Although these aren’t the prettiest of colors, these are pretty much the exact shades that I refer to in my mind when I think of these music notes, and I believe there is some natural logic to them. For example, if you take a C-major chord (C, E, G), it translates to red, yellow, and white. These are all warm colors. However, if you take a G-major chord (G, B, D), it translate to white, blue-violet, and green. These are all cool colors. Additionally, the notes G, A, and F are all “neutral” colors (white, off-white, brown), because they can be matched up with more chords, and thus more color combinations. I didn’t take music theory back in the day, so I am probably using the wrong terms, but hopefully you get the idea.

Through this project, I hope that viewers can get some perspective of what it is like to have synesthesia for music and color.

Final Project Proposal

My initial idea for my final project stemmed from my interest to explore synesthesia between music and color. I have perfect pitch and although I’m not sure if my synesthesia stems from this, I have a specific color associated with every note. I don’t specifically “see colors” when I listen to music, but I think it would be really cool to visualize what this would like, since I think there are some patterns between combination of notes and color (i.e. in chords).

In order to explore this visualization, I want to create a “music video” (i.e. through some sort of generative landscape) that uses line forms to represent the different melodies in a song. I’m thinking about doing a video to Mirror Maru by Cashmere Cat or Kusanagi by Odesza and will probably use Audacity to shorten it since a four-minute song might be a lot of work. The lines will go higher in the canvas with a higher note, and lower in the canvas with a lower note. Each line will represent a different notes in real-time and will change color according to my own note color scheme.

finalprojectproposal12
A very basic example of what the line forms could look like. Unfortunately, I did not have other colors at the time…

I’m also thinking about incorporating shapes as well, but for now I will stick to line forms. I am also open to suggestions for improvement, so feel free to let me know if you have any!

Looking Outwards 12: Sound Calligraphy/Lyrical Wrap

For the final Looking Outwards post, I decided to compare the projects of artists Ulla Rauter‘s “Sound Calligraphy” and Ronald Pellegrino‘s “Lyrical Wrap.”

Ulla Rauter is a artist and musician whose works focus on the intersection of fine art and sound. Rauter’s “Sound Calligraphy” explores the relationship between script and sound. In a live performance, Rauter draws calligraphic forms, which is then translated into sound through a scanner that employs camera and computer technology; in other words, she is essentially exploring how to draw/write sound. It appears that she attempts to draw certain words (i.e. “somebody”) as shown by the words on the upper right-hand corner, but I am unsure how they correlate to the line marks she makes in her calligraphy. Before watching the performance video, I expected her to write words on the scanner and have them translate into sound.

Sound Calligraphy from Ulla Rauter on Vimeo.

Ronald Pellegrino is an artist that has been involved in intersecting sound and light through electronic art since its inception. His work “Lyrical Wrap” combines five decades of his work in electronic arts into a piece that pairs sound with abstract grids, lines, and various shapes that constantly change. I kind of like how the piece gives off a mysterious air, mostly due to the eerie sounds and accompanying holographic visuals. It makes the viewer feel like they are in some kind of weird dream. Pellegrino has a variety of similar videos, which can all be accessed through his Vimeo channel.

Lyrical Wrap from Ronald Pellegrino on Vimeo.

Project 11: Turtle Composition

turtle graphic

/*Emma Shi
eyshi@andrew.cmu.edu
Section B
Project 11
*/
var myTurtle;
var hexSize = 60;

function setup() {
  createCanvas(500, 500);
  background(0);
  frameRate(1);
  myTurtle = makeTurtle(200, 130);
}

function draw() {
  turtleBody();
}

function turtleBody() {
  myTurtle.penDown();
  for (j = 0; j < 25; j++){
    for (i = 0; i < 8; i++){
      myTurtle.forward(hexSize*j);
      myTurtle.right(45);//draws the turtle body
  }
}
  myTurtle.forward(hexSize/4);
  myTurtle.left(90);
  myTurtle.forward(hexSize/2);
  myTurtle.right(45);
  myTurtle.forward(hexSize/3);
  myTurtle.right(90);
  myTurtle.forward(hexSize/3);
  myTurtle.right(135);
  myTurtle.forward(hexSize/2.2);
  myTurtle.right(180);
  myTurtle.forward(hexSize/2.2);
  myTurtle.right(90);
  myTurtle.forward(hexSize/2);
  myTurtle.penUp();//draws turtle head

  myTurtle.penDown();
  myTurtle.left(90);
  myTurtle.forward(hexSize/3.5);
  myTurtle.left(315);
  myTurtle.forward(hexSize/2.5);
  myTurtle.left(90);
  myTurtle.forward(hexSize/2);
  myTurtle.left(300);
  myTurtle.forward(hexSize/2);
  myTurtle.left(320);
  myTurtle.forward(hexSize);
  myTurtle.left(210);
  myTurtle.forward(hexSize);
  myTurtle.left(320);
  myTurtle.forward(hexSize/2);
  myTurtle.left(180);
  myTurtle.forward(hexSize/2);
  myTurtle.left(115);
  myTurtle.forward(hexSize/1.9);
  myTurtle.left(115);
  myTurtle.forward(hexSize/2);
  myTurtle.left(60);
  myTurtle.forward(hexSize/10);
  myTurtle.left(30);
  myTurtle.forward(hexSize/2.1);
  myTurtle.penUp();//draws upper right fin

  myTurtle.penDown();
  myTurtle.right(120);
  myTurtle.forward(hexSize/1.55);
  myTurtle.left(45);
  myTurtle.forward(hexSize);
  myTurtle.left(45);
  myTurtle.forward(hexSize/2.5);
  myTurtle.left(270);
  myTurtle.forward(hexSize/2);
  myTurtle.right(300);
  myTurtle.forward(hexSize/2);
  myTurtle.right(320);
  myTurtle.forward(hexSize);
  myTurtle.right(210);
  myTurtle.forward(hexSize);
  myTurtle.right(320);
  myTurtle.forward(hexSize/2);
  myTurtle.right(180);
  myTurtle.forward(hexSize/2);
  myTurtle.right(115);
  myTurtle.forward(hexSize/1.9);
  myTurtle.right(115);
  myTurtle.forward(hexSize/2);
  myTurtle.right(60);
  myTurtle.forward(hexSize/10);
  myTurtle.right(30);
  myTurtle.forward(hexSize/2.1);
  myTurtle.penUp();//draws upper left fin

  myTurtle.penDown();
  myTurtle.right(60);
  myTurtle.forward(hexSize/2.7);
  myTurtle.right(315);
  myTurtle.forward(hexSize);
  myTurtle.right(315);
  myTurtle.forward(hexSize/2.5);
  myTurtle.left(270);
  myTurtle.forward(hexSize/2);
  myTurtle.right(300);
  myTurtle.forward(hexSize/2);
  myTurtle.right(320);
  myTurtle.forward(hexSize);
  myTurtle.right(210);
  myTurtle.forward(hexSize);
  myTurtle.right(320);
  myTurtle.forward(hexSize/2);
  myTurtle.right(180);
  myTurtle.forward(hexSize/2);
  myTurtle.right(115);
  myTurtle.forward(hexSize/1.9);
  myTurtle.right(115);
  myTurtle.forward(hexSize/2);
  myTurtle.right(60);
  myTurtle.forward(hexSize/10);
  myTurtle.right(30);
  myTurtle.forward(hexSize/2.1);
  myTurtle.penUp();//draws lower left fin

  myTurtle.penDown();
  myTurtle.right(60);
  myTurtle.forward(hexSize/2.7);
  myTurtle.right(315);
  myTurtle.forward(hexSize);
  myTurtle.right(315);
  myTurtle.forward(hexSize/1.5);
  myTurtle.right(90);
  myTurtle.forward(hexSize/2);
  myTurtle.left(300);
  myTurtle.forward(hexSize/2);
  myTurtle.left(320);
  myTurtle.forward(hexSize);
  myTurtle.left(210);
  myTurtle.forward(hexSize);
  myTurtle.left(320);
  myTurtle.forward(hexSize/2);
  myTurtle.left(180);
  myTurtle.forward(hexSize/2);
  myTurtle.left(115);
  myTurtle.forward(hexSize/1.9);
  myTurtle.left(115);
  myTurtle.forward(hexSize/2);
  myTurtle.left(60);
  myTurtle.forward(hexSize/10);
  myTurtle.left(30);
  myTurtle.forward(hexSize/2.1);
  myTurtle.penUp();//draws lower left fin
}

//////////////////////////TURTLE GRAPHICS/////////////////////////////

function turtleLeft(d) {
    this.angle -= d;
}
 
 
function turtleRight(d) {
    this.angle += d;
}
 
 
function turtleForward(p) {
    var rad = radians(this.angle);
    var newx = this.x + cos(rad) * p;
    var newy = this.y + sin(rad) * p;
    this.goto(newx, newy);
}
 
 
function turtleBack(p) {
    this.forward(-p);
}
 
 
function turtlePenDown() {
    this.penIsDown = true;
}
 
 
function turtlePenUp() {
    this.penIsDown = false;
}
 
 
function turtleGoTo(x, y) {
    if (this.penIsDown) {
      stroke(this.color);
      strokeWeight(this.weight);
      line(this.x, this.y, x, y);
    }
    this.x = x;
    this.y = y;
}
 
 
function turtleDistTo(x, y) {
    return sqrt(sq(this.x - x) + sq(this.y - y));
}
 
 
function turtleAngleTo(x, y) {
    var absAngle = degrees(atan2(y - this.y, x - this.x));
    var angle = ((absAngle - this.angle) + 360) % 360.0;
    return angle;
}
 
 
function turtleTurnToward(x, y, d) {
    var angle = this.angleTo(x, y);
    if (angle < 180) {
        this.angle += d;
    } else {
        this.angle -= d;
    }
}
 
 
function turtleSetColor(c) {
    this.color = c;
}
 
 
function turtleSetWeight(w) {
    this.weight = w;
}
 
 
function turtleFace(angle) {
    this.angle = angle;
}
 
 
function makeTurtle(tx, ty) {
    var turtle = {x: tx, y: ty,
                  angle: 0.0, 
                  penIsDown: true,
                  color: color("green"),
                  weight: random(1),
                  left: turtleLeft, right: turtleRight,
                  forward: turtleForward, back: turtleBack,
                  penDown: turtlePenDown, penUp: turtlePenUp,
                  goto: turtleGoTo, angleto: turtleAngleTo,
                  turnToward: turtleTurnToward,
                  distanceTo: turtleDistTo, angleTo: turtleAngleTo,
                  setColor: turtleSetColor, setWeight: turtleSetWeight,
                  face: turtleFace};
    return turtle;
}

I started out with creating a geometric turtle. I drew a very simple sketch to get an idea of how I would be directing the turtle’s pen.

turtle-sketch

While I was originally going to have the turtle rotate according to the user’s mouse, I ended up playing around with it and create a self-drawing “turtle spiral.” A possible beginning-to-end image rendition is shown below.

The original turtle.
An intermediate stage.
screen-shot-2016-11-10-at-12-46-54-am
A possibility for a final image.

Looking Outwards 11: This City

This City from Mark Wheeler on Vimeo.

“This City” is an audiovisual performance by Mark Wheeler (also known as Mark Eats) meant to explore the parallel between sound creation and what is happening in the real world. In other words, Wheeler was interested to see what happens when music controls the visuals as much as the visuals influence the music. To create the setup of the performance, Wheeler connected two synthesizers to an app that produced the real-time visuals of city traffic. The visuals software was built using openFrameworks and is dictated by a map that has rules for traffic flow, junctions, and traffic lights. The software can add cars, each with their unique characteristics in speed and aggressiveness.

While I don’t know details about the specific kinds of software he uses, he has a tech walkthrough video, which is displayed below:

Project 10: Generative Landscape

sketch

/*Emma Shi
eyshi@andrew.cmu.edu
Section B
Project 10
*/

var waveSpeed = 0.0002;
var waveDetail = 0.002;
var waves = 4;
var waveHeight = 0;
var deepColor;
var lightColor;
var clouds = [];

function setup() {
  createCanvas(500, 300);
  frameRate(20);

  for (var i=0; i<5; i++){ 
    var rx = random(width);
    var ry = random(height - 100);
    clouds[i] = new Clouds(rx, ry);
    }  
}
 
function draw() {
  
  drawBackground();
  drawSun();
  drawWaves();
  updateAndDisplayClouds();
  removeCloudsThatAreOutOfView();
  addNewCloudsWithSomeRandomProbability(); 

}

function drawBackground() {
  for (var i = 0; i < 50; i++) {
    noStroke();
    var rBackground = 167 + i;
    var gBackground = 209 + i;
    var bBackground = 241 + i
    fill(rBackground, gBackground, bBackground);
    rect(0, i, width, height);
  }//draws background/sky with some color gradient
}

function drawWaves() {
  var deepColor = color(22, 104, 180);
  var lightColor = color(15, 153, 189);

  for (j = 0; j < waves; j++) {
    noStroke(); 
    fill(lerpColor(deepColor, lightColor, j/(waves - 1)));
    beginShape(); 
    for (var x = 0; x < width; x++) {
      var t = (x * waveDetail) + (millis() * waveSpeed);
      var y = map(noise(t * j/waves, waveHeight), 0, 1, 70*j, height);
      vertex(x, y); 
    }
      waveHeight += 0.0008;
      vertex(width, height);
      vertex(0, height);
      endShape(CLOSE);
  }//draws four waves
}

function drawSun() {
  noStroke();
  fill(240, 170, 77);
  ellipse(width/2, height/2, 200, 200);
}//draws sun

function updateAndDisplayClouds() {
  for (var k = 0; k < clouds.length; k++) {
    clouds[k].move();
    clouds[k].display();
    }//updates and displays cloud positions
}

function removeCloudsThatAreOutOfView() {
  for (var l = 0; l < clouds.length; l++) {
    if (clouds[l].x < 0-clouds[l].breadth) {
        clouds.splice(l, 1); 
    }
  }
}//removes clouds that disappear from the view

function addNewCloudsWithSomeRandomProbability() {
  var newCloudLikelihood = 0.003; 
  if (random(0, 1) < newCloudLikelihood) {
    clouds.push(new Clouds (width, random(height - 200)));
  }
}//adds a new cloud to the end with a small probability

function Clouds (birthLocationX, birthLocationY){
  this.x = birthLocationX;
  this.y = birthLocationY;//birth location of clouds

  this.speed = -0.7;//speed of clouds
  
  this.move = function() {
  this.x += this.speed;
  }//clouds change position
    
  this.display = function() { 

  push();
  translate(this.x, this.y);
  fill(255); 
  stroke(255); 
  ellipse(10, 10, 40, 10);
  fill(240);
  stroke(240);
  ellipse(3, 6, 30, 7);
  pop();
  }//draws clouds
}

A very simple sketch of the landscape.

I originally thought about doing a landscape of the city, but amidst the stress from schoolwork and other activities, I thought doing an calming ocean landscape might be more relaxing. I started out by sketching the very basic landscape and listing out some ideas I had on what it could look like (i.e. using birds or clouds as the JavaScript object, or depicting a sunrise/sunset). I also wanted to originally use the mousePressed function to allow the user to click the mouse and change the background from sunrise to sunset, but unfortunately I couldn’t get it to cooperate.

Looking Outwards 10: Delicate Boundaries

I looked at the work of Chris Sugrue, who is an artist and programmer focused on developing interactive installations, audio-visual performances, and experimental interfaces. A graduate of Parsons School of Design, her work plays with technology through investigating topics such as artificial life, eye-tracking and optical illusions.

I was intrigued by Sugrue’s project, “Delicate Boundaries,” which is an interactive installation that serves as a representation of how our “digital world” (i.e. smartphones, tablets, and laptops) creeps into our physical world (our bodies). Sugrue created small bugs made of light that crawl onto users’ bodies when they interact with the installation, leading to an interesting effect in which people attempt to swat away bugs that only exist virtually. This might also be interpreted as people trying to separate their physical world from their digital one.

For “Delicate Boundaries,” Segrue received an honorary mention from Vida Art and Artificial Life Awards and first prize from Share Festival.

Delicate Boundaries
Delicate Boundaries

Delicate Boundaries from csugrue on Vimeo.

Project 9: Computational Portrait

For this portrait project, I chose to feature a picture I took of my youngest sister eating a donut.

The original image.
The original image.

I wanted to play with varying shape and size of pixels, so I created a program that starts out with drawing large rings of the image, and then with each click of the mouse, the rings incrementally decrease in size (until a certain point). Additionally, in order to play with shape, rectangles instead of rings are drawn when the user moves the mouse across the canvas (and the rectangles also decrease in size as the mouse is clicked).

Below are two renditions of what the image could ultimately look like. Of course, there are many more possible images that could be generated, since the presence of rings or rectangles and their respective sizes are controlled by the user’s command of the mouse.

screen-shot-2016-10-27-at-12-51-59-am

screen-shot-2016-10-27-at-12-53-15-am

sketch

/*Emma Shi
Section B
eyshi@andrew.cmu.edu
Project 9
*/

var img;
var outlineWH = 30;

function preload(){
    var imgURL = "http://i.imgur.com/8xc0iz2.jpg"
    img = loadImage(imgURL);
}

function setup() {
    createCanvas(400, 533);
    background(0);
    img.loadPixels();
}

function draw() {
    var px = random(width);
    var py = random(height);
    var ix = constrain(floor(px), 0, width);
    var iy = constrain(floor(py), 0, height);
    var ColorXY = img.get(ix, iy);

    stroke(ColorXY);
    strokeWeight(2);
    noFill();
    ellipse(ix, iy, outlineWH, outlineWH);//draws circles that appear to make the image complete
    rect(mouseX, mouseY, outlineWH, outlineWH);//draws squares according to mouse movement
   }

function mousePressed() {
    if (outlineWH == 30) {
        outlineWH = 25;
    } else if (outlineWH == 25) {
        outlineWH = 20;
    } else if (outlineWH == 20) {
        outlineWH = 15;
    } else if (outlineWH == 15) {
        outlineWH = 10;
    } else if (outlineWH == 10) {
        outlineWH = 5;
    }
    //the size of the circles and squares decreases by 5 with each click

}

Looking Outwards 9: Selfiecity (from Sihan)

While there are many interesting projects students chose to write about in the “Looking Outwards” posts, I was really interested in Sihan’s post about the Selfiecity project. The man behind the project, Dr. Lev Manovich, and his team are interested in examining the style of selfies in five cities – Bangkok, Berlin, Moscow, New York, and Sao Paulo. By poring through thousands of individual photos, the Selfiecity team has been able to uncover patterns on selfie styles, taking into account aspects such as head tilt, smile, age, gender, and more. For instance, it was found that in all cities, women took more selfies than men, and people in Moscow smiled the least.

An "imageplot" from Bangkok selfies.
An “imageplot” from Bangkok selfies.
A visual distribution of people's selfies in New York, ranging from an unhappy to a happy mood (left to right) and organized by gender (females on the top, males on the bottom)
A visual distribution of people’s selfies in New York, ranging from an unhappy to a happy mood (left to right) and organized by gender (females on the top, males on the bottom)

Like Sihan, I would imagine that the face recognition algorithm behind the selfies would collect quantitative data (i.e. eye position in proportion to the face, head tilt angle, etc.). Although there has been extensive work done on this project, I think it’s difficult to concretely measure certain aspects of a person’s selfie, such as emotion. I also think it would be interesting for the team to create visualizations of people’s selfies by gender, as I would imagine that men and women may also take selfies in different styles.

Looking Outwards 8: Mapping Police Violence


Eyeo 2015 – Deray Mckesson and Samuel Sinyangwe from Eyeo Festival // INSTINT on Vimeo.

In light of the news regarding race relations and police violence, I was immediately interested by Deray Mckesson and Samuel Swey’s project, “Mapping Police Violence,” which was presented at the Eyeo Festival 2015. Mckesson is a civil rights protestor, educator, and is known as one of the most prominent figures in the Black Lives Matter movement. Swey is a policy analyst and data scientist focused on using policy to end systemic racism.

In their presentation, Mckesson and Swey highlight the power of storytelling and social media in bringing police violence experiences and race issues to light. For instance, Twitter has been instrumental in generating a dialogue about these topics. However, while these stories shared through social media platforms were hugely impactful, they saw a lack of (and thus a need) for backing them up with quantitative data. Thus, “Mapping Police Violence” was born out of a desire to conduct more research on police violence and create visualization of the data. From infographics based on the most highly concentrated locations of police violence, statistics on national trends in violence, and reports coded by race, the project’s website aims to present as much data and quantitative context as possible from the past 300 days of protests. These infographics help uncover patterns of severity and provide better solutions.

This project (and the presentation) really interests me for a very obvious reason — these men see a lack of information in a highly-salient topic and aim to deliver solutions. They present the information in a way that is easy to follow. Before listening to their lecture, I had never considered that there was such little data being collected by the government related to police violence. It also helped emphasize how truly powerful social media can be used as a tool for telling these unheard experiences. The infographics provided on their site (especially the police violence map on the home page) really provides a powerful image of the extent of this issue.

“Mapping Police Violence” isn’t the only project the two men have worked on together. You can also check out another project they’ve worked on called Campaign Zero, which aims at creating effective policy solutions to end police violence.