Grace Cha – Project 07- Curves

myshapes

For this project I worked with the Astroid Radial Curve.  I was really surprised that this function created so many varied curves, and while playing around with it, I had a lot of fun adding values and switching up the boundaries for the equation.

note:  Hover & Click mouse over the Canvas to start *

sketch

//Grace Cha
//Section C
//heajinc
//Project 07: Composition with Curves


var nPoints = 500;// the amount of lines
var boxConstrain = 150; //constrains the small box within an area initially


function setup() {
  createCanvas(500, 500);
  frameRate(15); //make it slow enough to view changes 
  
}

function draw() {
  background(0);

  //call my shape twice
  myShape();

  push();//rotate myShape()
  translate(-30,-350);
  rotate(radians(40));
  myShape();
  pop();
}

function myShape() {
  translate(width/2, height/2);
  stroke(255);
  strokeWeight(.3);//make it thin to visualize the lines better
  noFill();
  //Manipulated to react to mouseX and mouseY location
  var h = constrain(mouseY/10, 0, boxConstrain); //constrain shape 
  var w = constrain(mouseX/10, 0, boxConstrain);//constrain shape 
  
  push();
  beginShape();
  for (var i = 0; i < nPoints; i++) {
    var t = map(i, 0, nPoints, 0,  TWO_PI); 
    
    //Astroid Radial Curve
    //http://mathworld.wolfram.com/AstroidRadialCurve.html
    var x = boxConstrain * pow(cos(t * w),3);
    var y = boxConstrain * pow(sin(t * h),3);
    //stroke(242,183,5)
    stroke("#EEE1EE");
    point(x, y, 10 *i , 10 *i); //adds point at each vertex 
    curveVertex(x , y); //to add curves rather than jagged edges
  }
  endShape();
}
function mousePressed(){
	nPoints = random(5, 360); //number of lines/points 
	boxConstrain = random( 100, 500); //constrains
}

Grace Cha-Looking Outwards-07- Information Visualization

Nicholas Feltron Personal Annual Report

screen-shot-2016-10-11-at-9-26-06-pm
Feltrons’s collection of personal annual data report 2009
052x-2
Feltrons’s annual summary of personal relationship

I found Nicholas Feltron’s data visualization brilliant and kind of really funny.  He gathers rather random everyday data for an entire year and creates a personal annual data report.  The particular one I chose to show was his 2009 annual report about his Relationships with people.  From parents to old friends to new acquaintances, everyone who had a “significant” encounter with Nicholas in 2009 received an invitation to contribute to that year’s Annual Report.

I thought the subject of this data visualization was entertaining, and pretty clear enough to read.  He chose to graph the data using wave like forms to detail his encounters. He states that used Processing to help his visualize his data and some other programs.  I appreciate his adventure out of the standard bar graph to display an entertaining and visually pleasing spread.


Source: feltron.com

Grace Cha–Project 06 – Abstract Clock

sketch

//Grace Cha
//Section C
//heajinc@andrew.cmu.edu
// 6. Project 06 – Abstract Clock

//This is inspired by cellular mitosis and splitting of chromosomes. 
//The way you tell time is by  measuring the center to each side of the width

//HOUR:  Tallest circular object (up/down way)
//Minute: medium tallest object 
//Second: shortest object
var prevSec;
var millisRolloverTime;

//time variables
var H;
var M;
var S;

//These lines are for the random changing dots
var x = [];
var y = [];
var dx = [];
var dy = [];
var col = [];
var dots = 100;

function setup() {
    createCanvas(600, 600);
    millisRolloverTime = 0;
    for (var i = 0; i < 200; i ++){
        H = hour();
    	M = minute();
    	S = second();
        x[i] = random(width) * cos(radians(20));
        y[i] = random(height) * sin(radians(20));
        dx[i] = H;//use seconds just as a velocity movement 
        dy[i] = M;//this does not actually move per second. 
        col[i] = color(random(255), random(255), random(255),150);  
    }
}
function draw() {
    background(0); 
    M = minute();
    S = second();

    if (prevSec != S) {
        millisRolloverTime = millis();
    }
    prevSec = S;
    var mils = floor(millis() - millisRolloverTime);

    //this makes time go by 12 hours
    if (H > 12){
    	H = H - 12;
    }
    //this make 12 o clock "12" rather than "0"
    if (H == 0){
    	H = 12;
    }

    push();
    var r = 40 + 25 * sin(millis() / 1000.0 );
    var g = 230 + 25 * sin(millis() / 1000.0 + HALF_PI);
    var b = 230 + 25 * sin(millis() / 1000.0 - HALF_PI);
    fill(0,g,b,140);
    text("Hour: "   + H, 10, 22);
    pop();


    push();
    var r = 100 + 25 * sin(millis() / 1000.0 );
    var g = 100 + 25 * sin(millis() / 1000.0 + HALF_PI);
    var b = 100 + 25 * sin(millis() / 1000.0 - HALF_PI);
	fill(r,g,0);
    text("Minute: " + M, 10, 42);
    pop();

    push();
    var r = 230 + 25 * sin(millis() / 1000.0 );
    var g = 230 + 25 * sin(millis() / 1000.0 + HALF_PI);
    var b = 230 + 25 * sin(millis() / 1000.0 - HALF_PI);
    fill(r,0,0);
    text("Second: " + S, 10, 62);
    pop();
    
    var hourGrowth= map(H, 0, 12, 0, width);
    var minuteGrowth = map(M, 0, 59, 0, width);
    var secondGrowth  = map(S, 0, 60, 0, width);
    
    //These are just random changing lines to add some interest 
    for (var i = 0; i < dots; i ++){
    	fill((col[i]),150);
        noStroke();
        ellipse(x[i], y[i], 5, 5);
        x[i] += dx[i];
        y[i] += dy[i];

        if (x[i] > width) {
            x[i] = 0;
        }  else if (x[i] < 0) {
            x[i] = width;
        }
        if (y[i] > height){
            y[i] = 0;
        }
        else if (y[i] < 0) {
            y[i] = height
        } 
    }

    //Second movement
    push();
	var r = 230 + 25 * sin(millis() / 1000.0 );
    var g = 230 + 25 * sin(millis() / 1000.0 + HALF_PI);
    var b = 230 + 25 * sin(millis() / 1000.0 - HALF_PI);
	for(var i = 0; i <20; i ++){
		strokeWeight(1);
		noFill();
		stroke(r,0,0,90);
		var c = (i * 10);
		ellipse(width/2, height/2, secondGrowth,c);
	}
	pop();


	//Minute Movement
	push();
	for(var i = 0; i <40; i ++){
		strokeWeight(.8);
		
		noFill();
		var r = 100 + 25 * sin(millis() / 1000.0 );
        var g = 100 + 25 * sin(millis() / 1000.0 + HALF_PI);
        var b = 100 + 25 * sin(millis() / 1000.0 - HALF_PI);
		stroke(r,g,0,120);
		var b = (i * 12);
		ellipse(width/2, height/2, minuteGrowth, b);
	}
	pop();
	
	//Hour Movement
	push();
	var r = 40 + 25 * sin(millis() / 1000.0 );
    var g = 230 + 25 * sin(millis() / 1000.0 + HALF_PI);
    var b = 230 + 25 * sin(millis() / 1000.0 - HALF_PI);
    //background (r,g,b); 
	for(var i = 0; i < 30; i ++){
		strokeWeight(.7);
		noFill();
		stroke(0,g,b,140);
		var d = (i * 20);
		ellipse(width/2, height/2, hourGrowth, d);
	}
	pop();
}

Process: 

I was inspired by the movements of mitosis to construct my abstract clock.  The way that chromosomes are split from the center to the sides of the cell is something I tried to replicate.  Each circular object is differnt measure: second, mins, hour.

The idea is that time is measured by the distance from the center to each side of the width.  The Hour is the tallest circular object (up/down way), the minute is medium tallest object, and the seconds are the shortest object.  The smaller dots are random generated dots that are different whenever the page is refreshed.

img_1818

screen-shot-2016-10-07-at-4-08-27-pmscreen-shot-2016-10-07-at-10-38-59-pm


Grace Cha – Looking Outwards- 06- Randomness

This was actually a student project from RISD Architecture class called: Coding Architecture in 2015, but I found it just as intriguing as any other project from a professional.  Aaron Tobey, decided to generate a manually -operated random machine with geometry.

For instance, he created a rectangle as the seed and then let the line bounce within the rectangle on a set of rule.  Numbers are generated based on where the line intersects the  edge of the rectangle.  Behind it all are a set of complex series of geometric operations and logical rules to build this random sequence.  Here he repeats this process over many boxes on the canvas. I like the way this view allows one to observe the behaviors of randomness at a distant level.  This sort of macro view of randomness reveals an interesting phenomenon–almost reveals a deep structural pattern.  Although I’m not too certain if he used actual randomness or pseudo-randomness, it is interesting to note the complexity in trying to create “randomness” (because even if it appears to be random, at a macro level, it looks sort of like a pattern).

For the time being, I’ve never thought twice about the origins of the random() function or even if it’s actually random or not, but this blog post has made me wonder what which type of random is needed for a particular situation.


Coding Architecture Course Website: http://lostritto.com/risd2015spring-seminar/


Grace Cha – 05 – Wallpaper

sketch

// Grace Cha
//Section C
//heajinc@andrew.cmu.edu
//Project 5: Wallpaper

var y = 0;//the pattern starts at the top of canvas
function setup() {
    createCanvas(640, 480);
    noStroke();
}
function draw() {
    background("#D9D4C8");
    //background("#47505A");
    for(y; y < height + 90; y += 50){
    myTriangles();//the blue triangle
    myTriangles1();//the orange outlined triangles
    }
    noLoop(); // save computation -- no animation
}

function myTriangles(){
    for (var x = - 90; x < width; x += 30){
    fill(82,100,129,110);
    beginShape(TRIANGLES);  //This draws 2 blue triangles
    vertex(x + 10, y);
    vertex(x + 30 , y-55);
    vertex(x + 50, y);
    vertex(x + 70, y-55);
    vertex(x + 90, y);
    vertex(x + 110, y-55);
    endShape();
 }
}

function myTriangles1(){
    for (var x = -90; x < width ; x += 20){
    noFill();
    stroke("#F0A321");
    strokeWeight(1);
    beginShape(TRIANGLES); //This draws 2 outlined orange traingles
    vertex(x + 10, y);
    vertex(x + 30 , y-55);
    vertex(x + 50, y);
    vertex(x + 70, y-55);
    vertex(x + 90, y);
    vertex(x + 110, y-55);
    endShape(); 
 }
}


Process

Wow!  the for loop and nested for loop really eliminate the need for long code.   I was inspired by the traditional “Cradle Quit” color scene/pointy star pattern and the modern plaid sweater(finally sweater weather!) to design my wallpaper. To add a geometric vibe to it, I tried using triangles and overlapping lines to create visual balance.

screen-shot-2016-09-30-at-12-56-29-pm
“Cradle Quit” In exhibit at National Museum of American History, Smithsonian Institution. Date of Production: 1836
screen-shot-2016-09-30-at-12-59-04-pm
Source: Pinterest. tartan- plaid pattern.

Grace Cha – Looking Outwards – 5

Altered Experiments 52 - kinetic entanglement
Lee Robinson’s “kinetic entanglement” Is inspired by the artist’s fascination with complex natural forms, particularly kinetic energy. It is made using Cinema4D and After effects. Source: Altered.tv

I discovered Lee Robinson, a Art Director, Motion Graphics Designer and Photographer, based in London while perusing through Pinterest, and found all his work to be incredibly charming.  He does these random exercises every so often that displays 3D renditions of things ranging from whimsical concept art to abstracted materials such as glass-like objects.  This particular piece, called Kinetic Entanglement, stood out to me because of its erie- out – of- this- world factor. The special use of glass like stick and objects displays a delicate yet captivating phenomenon.

Lee Robinson is using Cinema4D  for this exercise to generate sophisticated dimensional forms and After Effects to make it come alive through motion.

Grace Cha – 04 – String Art

sketch

//Grace Cha 
//Section C
//heajinc@andrew.cmu.edu
//PROJECT-04- STRING ART

function setup() {
    createCanvas(640,480);
}

function draw() {
	background(0);
      
	for (var i = 20; i < 480; i += 5) { //start at 20 to 400 by increments of 5

      ////////EACH COLORED 'BRIDGE' IS MADE BY TWO CURVES SHAPES THAT MEET IN THE MIDDLE ///////

      var xx = i * .3; //second x value of LEFT CURVE
      var mirrorImage = width - i; //first x value of RIGHT CURVE
      var mirrorImage1 = width - i * .3; //second x value of RIGHT CURVE
      var curveHeight = 400; //first y value of curve lines
      var curve = HALF_PI * i; //second y value of curve lines 

      var flippedHeight = height - curveHeight; 
      var flippedCurve = height - curve;


      strokeWeight(7);
      stroke(232,244,31,20); //YELLOW TWIST IN CENTER
      line( i + 100, 200, i / 20, PI+QUARTER_PI * i) //LEFT FLAP
      line( mirrorImage, 200, width - i / 20,PI+QUARTER_PI * i); //RIGHT FLAP

      //EACH COLORED 'BRIDGE' IS MADE BY TWO CURVES SHAPES  
      strokeWeight(1);
      stroke(155,31,239,60); //MIDDLE PURPLE
      line(i + 250 ,curveHeight, xx + 250, curve); //LEFT CURVE 
      line(mirrorImage -250, curveHeight, mirrorImage1 - 250, curve); //RIGHT CURVE

      stroke(9,157,150,60); //TEAL
      line(i + 200 , curveHeight, xx + 200, curve);//LEFT CURVE 
      line(mirrorImage - 200, curveHeight, mirrorImage1 - 200, curve);//RIGHT CURVE
      
      stroke(4,74,168,60);//BLUE 
      line(i + 150 ,curveHeight, xx + 150, curve);//LEFT CURVE 
      line(mirrorImage - 150, curveHeight, mirrorImage1 - 150, curve);//RIGHT CURVE

      stroke(199,66,71,96); //CENTERMOST BURGENDY
      line(i + 100 ,curveHeight, xx + 100, curve);//LEFT CURVE 
      line(mirrorImage -100, curveHeight, mirrorImage1 - 100, curve);//RIGHT CURVE
      
      stroke(239,65,54,99); //RED
      line(i + 50, curveHeight, xx + 50, curve);//LEFT CURVE 
      line(mirrorImage -50, curveHeight, mirrorImage1 - 50, curve);//RIGHT CURVE
      
      stroke(155,31,239,80); //FRONT VIOLET
      line(i , curveHeight, xx, curve);//LEFT CURVE 
      line(mirrorImage , curveHeight, mirrorImage1, curve);//RIGHT CURVE

      //////FLIPPPED VERSIONS///// I ONLY CHOSE A FEW TO FLIP  

      strokeWeight(1);
      stroke(155,31,239,60); //MIDDLE PURPLE
      line(i + 250 ,flippedHeight, xx + 250, flippedCurve);//LEFT CURVE 
      line(mirrorImage -250,flippedHeight, mirrorImage1 - 250, flippedCurve);//RIGHT CURVE

      stroke(199,66,71,96); //CENTERMOST BURGENDY
      line(i + 100 ,flippedHeight, xx + 100, flippedCurve);//LEFT CURVE 
      line(mirrorImage -100, flippedHeight, mirrorImage1 - 100, flippedCurve);//RIGHT CURVE
        
      stroke(155,31,239,80); //FRONT VIOLET
      line(i , flippedHeight, xx, flippedCurve);//LEFT CURVE 
      line(mirrorImage , flippedHeight, mirrorImage1, flippedCurve);//RIGHT CURVE
    }
}

My process included with some conditionals I wanted to make for my string art.  I largely played around with overlapping colors and opacity of string colors to indicate dimension.

img_1593
Some Idea Sketches.

GraceCha – LookingOutwards – 4

ENTROPIA

Fraction’s work on 3D ambisonics experimental music and joined by Louis-Philippe St Arnault, Nature Graphique and Creation Ex Nihilo which was presented during IX Symposium on immersive experience (may 2015).


Apart from the fact that I was drawn to the name of the project “Entropia” (reminds me of Entropy),  I was drawn to the magnitude and out-of-this-worldness of this sound artist “Fraction”(or in other words the eireness).  I was really impressed by the marriage of many aspects of the senses- audio, physical, and360° visuals- to give an interactive experience for the audience (who are laying down on their backs!)

The sound manipulation by immersive electronic music sound data (which is live time performed by the man in the globe) is translated to “physical sound” through use of complex lighting systems that are manipulated by the sound data real time.  It’s almost like a conversation between the light and sound.

screen-shot-2016-09-23-at-11-52-41-am
Light reacts to the sound data coming from dome
screen-shot-2016-09-23-at-11-53-12-am
3D interactive experience for views

Grace Cha- 03- Dynamic Drawing

 *Move Mouse Horizontally*

sketch

//Grace Cha
//Section C
//heajinc@andrew.cmu.edu
//Project-03-Dynamic Drawing

var modifier = 50;
var miniCircle = 80;

function setup() {
    createCanvas(640,480);  
}

function draw() {

  //BACKGROUND CHANGING 
	var colorR = map(mouseX, 0, width, 145, 0);
    var colorG = map(mouseX, 0, width, 211, 0);
    var colorB = map(mouseX, 0, width, 246, 0);
    background(colorR, colorG, colorB); 
    noStroke();


// MINI UNMOVING CIRCLES
    stroke("#14BC98");
    strokeWeight(5);
    ellipse(miniCircle, height/2, 10,10); // FARTHEST LEFT CIRCLE
    ellipse(7 * miniCircle, height/2, 10,10); // FARTHEST RIGHT CIRCLE
    ellipse(width/2,3 * height/4, 10,10);  //BOTTOM CIRCLE
    ellipse(width/2, height/4, 10,10); 


    fill(60, 120, 140);


//CIRCLE GROWTHS
// BOTTOM RIGHT CIRCLE GROWTH
    ellipse(3 * width/4, 3 * height/4, modifier, modifier);
    
    // BOTTOM LEFT CIRCLE GROWTH
    ellipse(width/4, 3 * height/4, modifier, modifier);

    // TOP RIGHT CIRCLE GROWTH
    ellipse(3 * width/4, height/4, modifier, modifier);

    // TOP LEFT CIRCLE GROWTH
    ellipse(width/4, height/4, modifier, modifier);

    // BOTTOM RIGHT CIRCLE GROWTH
    ellipse(3 * width/4, 3 * height/4, modifier, modifier);

    // CENTER CIRCLE GROWTH
    ellipse(width/2, height/2, modifier, modifier);

    if (mouseX >= width/2) {
    modifier = modifier + .5; //GROWTH
    } else{
    modifier = modifier - .5; //DECREASING
    }
    if (modifier <0){
      modifier = (-1) * modifier; // RESTRICT FROM GOING NEGATIVE
    }
    if (modifier > 100){
    modifier = modifier - .5;
    }

// CENTER CHUNK
	push();
	translate(width/2, height/2);
	rotate(-mouseX,10);
	fill(0,196,172);
	noStroke();
	quad(30, 300, 86, 20, 69, 63, 30, 90)
    noFill();
    stroke("#FDFEFD");
    stroke("#74E19F");
    strokeWeight(10);
    arc(50, 55, 50, 50, PI+QUARTER_PI, TWO_PI); 
	  pop();

// CENTER "X" SHAPED POLYGON
   push();
   translate(width/2, height/2);
   rotate(mouseX/70,10); //MAKES IT MOVE A LITTLE SLOWER
   fill("#358290");
   stroke("#FDFEFD");
   strokeWeight(5);
   quad(30, 100, 86, 20, 80, 63, 30, 90)
   pop();

//  CENTER ARCS 
    push();
    translate(width/2, height/2);
    rotate(mouseX/20,60); //ROTATION IS SLOWER
    stroke("#FDFEFD");
    strokeWeight(5);
    noFill();
    ellipse(0,0,10,10); //CENTER CIRCLE
    noFill();
    //ellipse(0,0, 120,120); //BIG CIRCLE
    arc(50, 55, 50, 50, PI+QUARTER_PI, TWO_PI);
    pop();

// TOP LEFT CHUNK
    push();
    var fillR = map(mouseX, 0, width,205, 185); // SHAPE COLOR CHANGES
    var fillG = map(mouseX, 0, width, 255, 245);
    var fillB = map(mouseX, 0, width, 246, 0);
    fill(fillR, fillG, fillB);
	translate(width/4, height/4);
	rotate(-mouseX/30,10);
    stroke("#14BC98");
    strokeWeight(5);
    quad(38, 31, 86, 20, 69, 63, 30, 76)
    quad(20, 31, 10, 10, 20, 40, 20, 76)
    ellipse(0,0,10,10); //CENTER CIRCLE
    noFill();
    ellipse(0,0, 120,120); //BIG CIRCLE
    pop();

//BOTTOM RIGHT CHUNK
    push();
    var fillR = map(mouseX, 0, width,205, 185); // SHAPE COLOR CHANGES
    var fillG = map(mouseX, 0, width, 255, 245);
    var fillB = map(mouseX, 0, width, 246, 0);
    fill(fillR, fillG, fillB);
    translate( 3 *width/4, 3* height/4);
    rotate(mouseX/30,10);
    stroke("#14BC98");
    strokeWeight(5);
    quad(38, 31, 86, 20, 69, 63, 30, 76)
    quad(20, 31, 10, 10, 20, 40, 20, 76)
    ellipse(0,0,10,10); //CENTER CIRCLE
    noFill();
    ellipse(0,0, 120,120); //BIG CIRCLE
    pop();

// Top RIGHT CHUNK
    push();
	translate(3 * width/4, height/4);
	rotate(-mouseX/1,10);
	stroke("#FDFEFD");
	strokeWeight(5);
    quad(38, 31, 86, 20, 69, 63, 30, 76)
    quad(20, 31, 10, 10, 20, 40, 20, 76)
    ellipse(0,0,10,10);//CENTER CIRCLE
    pop(); 

//  BOTTOM LEFT CHUNK
    push();
    translate( width/4, 3 * height/4);
	rotate(mouseX/1,10);
	stroke("#FDFEFD");
	strokeWeight(5);
    quad(38, 31, 86, 20, 69, 63, 30, 76)
    quad(20, 31, 10, 10, 20, 40, 20, 76)
    ellipse(0,0,10,10);//CENTER CIRCLE
    pop();
  
}

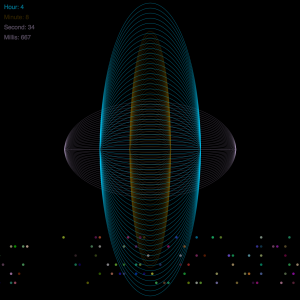
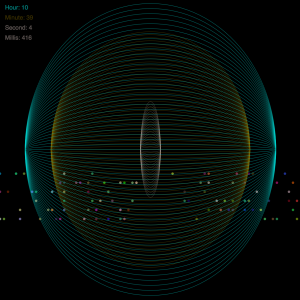
This project was inspired by hurricane movements.  Back at home (Texas), it is hurricane season so I thought I would like to replicate the spinning movements that are shown on the news. This project consisted of mostly trial and error and switching small aspects across the board.  I played around with different speeds, colors, size, and direction of movements.

GraceCha- Looking Outwards-3

Andrew Thomson’s  Geodesic Pendant Lamp

screen-shot-2016-09-13-at-10-20-46-pmscreen-shot-2016-09-13-at-10-29-25-pmscreen-shot-2016-09-13-at-10-29-19-pm

Andrew Thomson’s  Geodesic Pendant Lamp really resonates with me because it reminds me of a similar design project I was involved in. We were told to make paper lamps, and the planning behind making what seems so simple is actually quite difficult because of the considerations of use of material, particular context, and I think what makes this particular piece so impressive is the use of simple shaped wood cut outs to create a complex system of shapes.      Although it was machine made, I appreciate the process and planning that went into it.  This lamps was made by a technique called CNC Machining which is short for Computer Numerical Control which basically means a machine was used to cut the wood.  Machine made objects certainly help us humans perfect craft within an product, but I think the process of planning will always be part of designing products such as these.

http://www.core77.com/posts/23340/andrew-thomsons-geodesic-pendant-lamp-20-and-more-23340