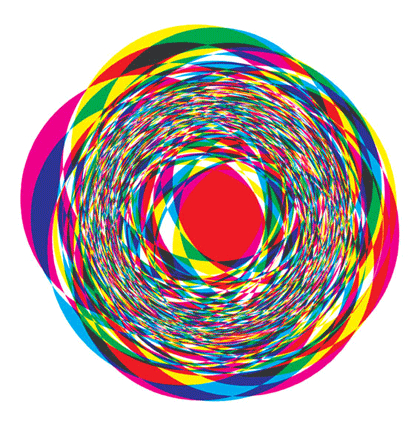
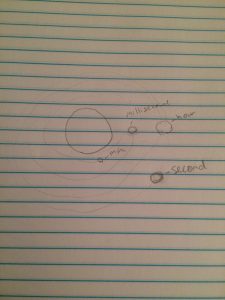
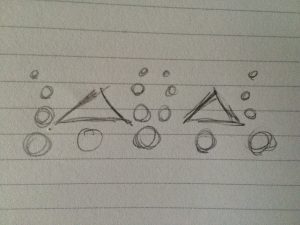
Project 07 Curves

This project was a lot of fun to experiment with. I originally planned to make something different, but as I experimented I developed this idea. I used the Scarabaeus Curve and realized it resembled a club from a deck of cards, which differed from my original idea to make it a flower. I had trouble with modifying the curve at first, but it got easier as I worked on it.

sketch

//Rebecca Enright
//Section A
//renright@andrew.cmu.edu
//Curve Composition

function setup() {
    createCanvas(640, 480);   
}

function draw() {
    background(255, 0, 0);    
    //draw club
    push();
    translate(width/2, height/2);
    CreateClub();
    pop();
    
}

function CreateClub() {
    //create variables for a, b, and nPoints
    var a = 50;
    var b = 100;
    var nPoints = 100;
    var pw = constrain((mouseX/50), 0, 10);
    var ph = constrain((mouseY/50), 0, 10);
    //create Scarabaeus curve
    fill(0);
    beginShape();
    for (var i = 0; i < nPoints; i++) {
        var t = map(i, 0, nPoints, 0, TWO_PI);  
        //function for curve      
        var r = b * cos(2 * t) - a * cos(t); 
        
        //create x and y for vertex
        var x = r * cos(pw + t);
        var y = r * sin(ph + t);
        
        vertex(x,y);  
    }
    endShape(CLOSE);
} 


Looking-Outwards 07

Lisa Jevbratt created several visualizations of data sets, but the one that most caught my eye was “Migration” created in 2005. She essentially mapped out the “migration interface” of websites from 1999-2004, and represented them through these little blobs of color that reminded me of tie-dye.

This image is taken from Jevbratt’s migration website, and it depicts the change in migration for the different websites over the course of 5 years through the little blobs of color. If you follow the link below, you can see how if you click on one of the blobs, it will give you a set of data (IP addresses) that describes the said migration of the websites. 


The link to Jevbratt’s 2005 Migration project is here.

The study originated in 1999, but had to be updated in 2005 due to the growth of technology and the need to keep up with it. The image and link above are for the updated version, while information about the original can be found at the link here.

I could not find a lot about the algorithms used in this visualization, but according to the description of the original project (linked above), the websites were randomly generated and their images were recorded so as to map out “all web servers in the database.” Because this study took place over the course of a few years, it also analyzes the changes made to such websites and the database over time.

This visualization is unique both in it’s subject of study as well as in its method of representation. We typically assume that data should be neatly mapped out and displayed, but this contradicts that in it’s messy yet understandable representation.

Looking Outwards-06

I found an image that I particularly liked (seen below), and discovered that it was by AGIA’s 2010 graphic design medalist John Maeda. He has an extensive background in research, technology and art, and was a professor at MIT, but is currently the president at Rhode Island School of Design. (This information was taken from the website here).

I was not able to find much about this particular picture, but I liked it a lot because of its colorfulness and how it appears to be random, yet it still created a pattern that vaguely resembles a flower of sorts.

However, I did find a TED talk that Maeda gave, and attached the link here. In it he discusses his background and various projects that he has done or is currently working on. There are also other works that he has done displayed on the webpage below the video.

Project-06-Abstract Clock

sketch

//Rebecca Enright
//Section A
//renright@andrew.cmu.edu
//Abstract Clock

function setup() {
    createCanvas(640,480);
    background(0);
} 

function draw() {
    background(0);
    //create variables for time functions
    var h = hour();
    var m = minute();
    var s = second();
    var mi = millis();

    //create sun 
    fill(255,255,0);
    ellipse(width/2,height/2,100,100);
    
    //create light blue second ellipse
    push();
    translate(width/2,height/2);
    //rotates ellipse every second (1 orbit = 1 minute)
    rotate(radians(360/60 * s));
    fill(0,255,191);
    ellipse(150,150,25,25);
    pop();
    
    //create green minute ellipse
    push();
    translate(width/2,height/2);
    //rotates ellipse every minute
    rotate(radians(360/60 * m));
    fill(181,255,0);
    ellipse(50,50,10,10);
    pop();
    
    //create maroon hour ellipse
    push();
    translate(width/2,height/2);
    //rotates ellipse every hour
    rotate(radians(360/24 * h));
    fill(189,0,75);
    ellipse(100,100,35,35);
    pop();

    //creates purple millisecond ellipse
    push();
    translate(width/2, height/2);
    //rotates ellipse every millisecond (1 orbit = 1 minute)
    rotate(radians(360/60000 * mi));
    fill(176,0,255);
    ellipse(75,75,15,15);
    pop();

}

It was fun thinking of ideas for this project, and when I was working with the simple clock assignment, I decided that I wanted to use rotation and reflect the general look of a clock, but in a different way.This then led me to the idea of a solar-system design. I also planned out the different “planets” and their locations in my sketch below.

img_6140

Project-05-Wallpaper

sketch

//Rebecca Enright
//Section A
//renright@andrew.cmu.edu
//Project-05-Wallpaper

function setup() {
    createCanvas(640,480);  
    noLoop();

}

function draw(){
	background(147,238,255);
//create loops for wallpaper
	for (var x = 100; x < width - 50; x = x + 100) {
		for (var y = 100; y < height - 50; y = y + 100) {
			Wallpaper(x,y);
		}
	}
}

function Wallpaper(x,y) {
//create center pink ellipse
    fill(255,187,245);
    ellipse(x,y,25,25);
//create top green triangle
    fill(0,255,126);
    triangle(x-30,y-25,x,y-50,x+30,y-25);
//create maroon side ellipses
    fill(196,41,158);
    ellipse(x + 50,y,25,25);
    ellipse(x - 50,y,25,25);
//create diagonal ellipses going above the green triangle
    fill(0,100,255); //creates blue color
    ellipse(x-40,y-25,10,10);
    fill(0,100,255); 
    ellipse(x+40,y-25,10,10);
    fill(220); //creates gray color
    ellipse(x-35,y-40,5,5);
    ellipse(x+35,y-40,5,5);
    fill(0);
    ellipse(x-38,y-50,2,2);
    ellipse(x+38,y-50,2,2);

    
}


I found this to be a very fun project. I had originally intended to create something more intricate, but I really enjoyed the simplicity of the picture that I sketched below, and so decided to create it instead. I also used the color-experimenting tool that the Week 1 notes linked to and found that I liked how these colors worked together.

img_6070

Rebecca Enright-Looking Outwards-05

Blur Studio located in Culver City, California creates beautiful 3D animation clips. Their images, which typically portray the unnatural, seem to somehow actually be real. They also have a video reel in the article about them, which can be seen here.

I never realized that some of the images in movies such as Thor (which was frequently displayed in the video reel), were made completely by utilizing computer graphics. The image below particularly caught my interest, though, because I found it to be very interesting to look at. I was not aware that this image and other images like it are made entirely from computer graphics. I had thought that they took videos and pictures of people and just added the effects in rather than being entirely computer-generated. I also thought that for the Thor action sequences as well, so it was a very cool thing to learn about.

This company was founded in 1995 by Tim Miller, a director, and David Stinnett, a visual effects supervisor. They presumably drew from their backgrounds in film to create this company and its productions, and they have certainly melded their prior experience with the rapid growth of technology for the duration of their company’s existence.

These 3D graphics have been storming screens everywhere, and, if made any more realistic, they have the potential to completely replace actors in films while still making a realistic-looking movie. Companies like Blur Studios are taking this cinematic revolution in stride as more and more animated clips are inserted into films to make for fantastic productions that marry the extraordinary with the mundane.

Project-04-String Art

sketch

//Rebecca Enright
//Section A
//renright@andrew.cmu.edu
//Project-04; String Art

function setup() {
    createCanvas(640, 480);
}

function draw() {
    background(0);
//iteration for dark blue lines
	for (i = 0; i < 20; i = i + 1) {
//create variable for changing y value
	    var a = (i * 10);
//dark blue lines across canvas left to right
        stroke(10,82,180);
        line(width/2, height/2, width - mouseX, a);
    }
//iteration for red lines
    for (i = 0; i < 20; i = i + 1) {
//reestablish a
        a = (i * 10);
//red lines from right to left across canvas
        stroke(255,0,0);
        line(width/2,height/2,mouseX,a);
    }
//iteration for green lines
    for (i = 0; i < 20; i = i + 1) {
//reestablish a    
        a = (i * 10);
//green lines going up from left to above the dark blue
        stroke(0,255,0);
        line(0, height, width/2, a);
//second set of green lines from right to above dark blue
        line(width,height,width/2,a);
    }
//iteration for pink lines
    for (i = 0; i < 50; i = i + 1) {
//create variables for x1, y1, x2, y2
    	var x = 0;
    	var y = 480;
    	var xx = 320;
    	var yy = 0;
//create variables for increments of x1,y1 and x2,y2
        var xstep = (i*20);
        var ystep = (i*5);
        var xxstep = (i*.1);
        var yystep = (i*10);
//increment x,y and xx,yy values
        x -= xstep;
        y -= ystep;
        xx += xxstep;
        yy += yystep;
//create pink curvy lines that overlap green
        stroke(255,124,155);
        line(x,y,xx,yy);
    }
//iteration for 2nd set of pink lines
    for (i = 0; i < 50; i = i + 1) {
//create variables for x1, y1, x2, y2
    	x = 640;
    	y = 480;
    	xx = 320;
    	yy = 0;
//create variables for increments of x1,y1 and x2,y2
        xstep = (i*20);
        ystep = (i*5);
        xxstep = (i*.1);
        yystep = (i*10);
//increment x,y and xx,yy values
        x += xstep;
        y += ystep;
        xx += xxstep;
        yy += yystep;
//create pink curvy lines near purple curve
        stroke(255,124,155);
        line(x,y,xx,yy);
    } 
//iteration for yellow lines
    for (i = 0; i < 50; i = i + 1) {
//create variables for x1, y1, x2, y2
    	x = 0;
    	y = 480;
    	xx = 0;
    	yy = 0;
//create variables for increments of x1,y1 and x2,y2
        xstep = (i*20);
        ystep = (i*5);
        xxstep = (i*.1);
        yystep = (i*10);
//increment x,y and xx,yy values
        x += xstep;
        y += ystep;
        xx += xxstep;
        yy += yystep;
//create yellow curvy lines
        stroke(255,255,0);
        line(x,y,xx,yy);
    }   
//iteration for purple lines
    for (i = 0; i < 50; i = i + 1) {
//create variables for x1, y1, x2, y2
    	x = 640;
    	y = 480;
    	xx = 640;
    	yy = 0;
//create variables for increments of x1,y1 and x2,y2
        xstep = (i*20);
        ystep = (i*5);
        xxstep = (i*.1);
        yystep = (i*10);
//increment x,y and xx,yy values
        x -= xstep;
        y += ystep;
        xx += xxstep;
        yy += yystep;
//create purple curvy lines that overlap green
        stroke(151,0,151);
        line(x,y,xx,yy);
    }
    for (i = 0; i < 43; i = i + 1) {
    	var a = (i * 15);
    	stroke(0,255,255);
    	line(width/2,height/2 - 50,a,480);
    }

}

This project was a lot of fun to experiment with. I have always wanted to try creating string art, and it’s a cool experience to do it using technology, especially because the strings have the ability to move if you want them to.

Looking Outwards -04

Google created the Tilt Brush in 2014 which had turned rooms into canvases, as it is a way to paint in virtual reality. They also have a feature that enables sound to affect the paint’s movement

As seen in the video above, this device allows you to essentially create your own world and bring it to life using sound. I am an avid daydreamer, and to create the worlds that I think of and have the ability to actually interact with them would be amazing.

taken from The Creators Project

I was unable to find much information about the algorithms used, but, since the sound-movement is an update and not a new device, I believe it builds from the original and just incorporates the sound through a new set of algorithms that can be combined with the pre-existing ones.

There are also links to the articles that I found about this below.

http://thecreatorsproject.vice.com/blog/paint-sound-with-audio-reactive-tilt-brush

http://www.theverge.com/2016/8/2/12350844/tilt-brush-virtual-reality-painting-music-visualization-audio-reactor

Project-03-Dynamic Drawing

sketch

//Rebecca Enright
//Section A
//renright@andrew.cmu.edu
//Dynamic Drawing

//creates variable for diameter
var  dia = 10
//creates variabe for grayscale color
var C = 255

function setup() {
    createCanvas(640, 480);
}

function draw() {
    background(255,100,125);
    //creates ellipse
    fill(C);
    ellipse(width/2,height/2,dia,dia);
    //ellipse gets larger/smaller and turns black
    if (mouseX > width/2) {
        C = C-10;
        dia = dia + 5;
    }
    //ellipse gets smaller/larger and turns white
    if (mouseX < width/2) {
    	C = C + 10;
    	dia = dia - 5;
    }
    //creates variables for colors
    var R = 100;
    var G = 0;
    var B = 255;

    //creates variable for rectangle side
    var s = 5;
    //variable for rectangle location
    var x = 320;
    var y = 240;
    
    //Rectangle changes
    if (mouseY < height/2) {
    //decreases red color component
        R -= 10;
    //increases green color component   
        G += 50;
    //decreases blue color component   
        B -=  10;
    //increases area
        s += 100;
    //moves rectangle up
        y += 20;
    //moves rectangle to the left
        x -= 20;
    }
    //Rectangle changes
    if (mouseY > height/2) {
    //increases red color component
        R += 50;
    //decreases green color component   
        G -= 10;
    //increases blue color component   
        B += 50;
    //decreases area
        s -= 50;
    //moves rectangle down
        y -= 20;
    //moves rectangle to the right
        x += 20;
    }
    //creates rectangle
    fill(R,G,B);
    rectMode(CENTER);
    rect(x,y,s,s);

}

I found this project to be rather difficult, however I really enjoyed experimenting with the different effects the movement of the mouse could have on the picture.

Looking Outwards -03

laser cut display for ICFF 2011 - front side

laser cut display for ICFF 2011 - back side

This digitally fabricated object is the most interesting jewelry holder I have ever seen. The creator, who is simply named Jessica on her blog, has been creating digitally fabricated jewelry ever since the scraps from one of her projects was mistaken for it in 2007. She creates these designs herself, therefore fabulously displaying both her technological finesse and her admirable creativity.

The only thing said about the algorithms used or how they designed it was that Jesse (presumably Jessica’s partner) used a processing program to develop the holes and connectors for the piece. Jessica does also state, though, that they used “a tangent planes method” to create each of the panels that they connected together.

Personally I really enjoy the shape and the coloring of this display and, if I had the room for it in my dorm, I would very much enjoy hanging my jewelry on it -perhaps something from Jessica’s collection!

A link to her blog about this particular creation is below, and there also is a picture of one of her bracelets that she designed.

we bought a laser cutter

radiolaria bracelet by Nervous System