ShanWang-Project-07-Curves

sketch

//Shan Wang
//Section A
//shanw1@andrew.cmu.edu
//Project-07

var nPoints = 300;
var a;
var x;
var y;
var posX;
var posY;
var color = 0;
var numLayer = 3;
var numCurve = 6;

function setup() {
    createCanvas(600,700);
}

function draw(){
    background(0);
    //constrain the x, y position of mouse;
    posX = constrain(mouseX, 0, width);
    posY = constrain(mouseY, 0, height);

    //control the amount that shift in x and in y direction with the position of mouse;
    var shiftY = map(posY, 0, height,1,5);
    var shiftX = map(posX, 0, width,1,5);

    //define unit of offsets;
    var intervX = width/10;
    var intervY = height/10;

    //generate three layer of multiple curves;
    for (var j = 0; j<numLayer; j++){
        for (var i = 0; i<numCurve; i++) {
            //cotrol the degree of curvatures with the change in mouse X;
            a = map(mouseX, 0, width, -width/3, width/2);
            //control the factor of scaling with the change of shift;
            var scaleX = shiftX/(3-j)*(i+1);
            var scaleY = shiftY/(3-j)*(i+1);
            //control the gradient;
            color = (i+1)*10*(j+3);
            drawConchoid(shiftX+i*intervX, shiftY+i*intervY,a,scaleX,scaleY,color);
        }
    }
}

// draw Conchoid of De Sluze Curve
function drawConchoid(sX, sY, a, scaleX, scaleY,color){
    push();
    stroke(color);
    //move the curvatures with the mouse;
    translate(posX,posY);
    beginShape(POINTS);
    for (var i = 0; i < nPoints; i++){
        var t =  map(i, 0, nPoints, 0, TWO_PI);
        x = (1/cos(t)+ a* cos(t))* cos(t);
        y = (1/cos(t)+ a* cos(t))* sin(t);
        x *= scaleX;
        y *= scaleY;
        vertex(x+sX,y+sY);
    }
    endShape();
    pop();
}

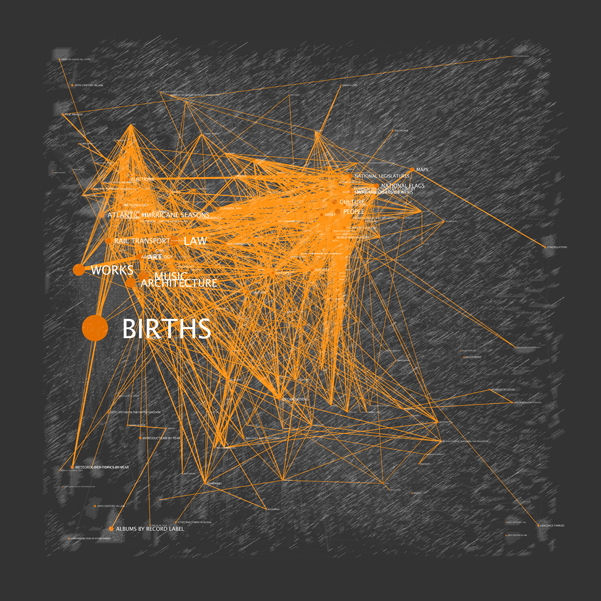
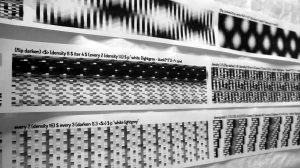
In this project I experimented with a lot of functions that create different curvatures, and I was mainly exploring the dynamic movement of the curves associating with the mouse.

I also tried to create black background in contrast with points of different gradient for a sense of space and depth.

ShanWang-LookingOutwards-07

0-0-history5

Five Levels Deep, centered on category of History

The WikiViz,  or the Visualizing Wikipedia project created by Chris Harrison was of particular interest to me. As a human edited entity and encyclopedia, connections between topics are really complicated and sometimes surprising. The comprehensive organization and visualization of these data are fascinating and sometimes revealing: it’s hard to believe how interconnected seemingly unrelated topics can be. Getting frustrated with GraphViz, Chris decided to build his own large-scale visualization project.

He demonstrated the progress in version 5 of this project in terms of graph layout algorithm, which allowed him to scale the enormous amount of vertices and edges (articles and article links) into a relatively manageable one with a shorter run time. For future improvement, he is still working on the collection of true page links with data directly from article content for a more accurate representation of Wikipedia’s true structure.

He had included some sample renderings of topics centered on different categories on his website.

ShanWang-Project06-Abstract Clock

sketch

//Shan Wang
//Section A
//shanw1@andrew.cmu.edu
//Assignment-06-Project

function setup() {
    createCanvas(600,600);
}


function draw() {
    background('#E79460')
    var cX = width/2;
    var cY = height/2;
    var lX = width/2;
    var lY = height/2;
    var rX = width/2;
    var rY = height/2;
    var sX = width/2-40;
    var sY = height/2+70;
    var sec = second();
    var min = minute();
    var hr = hour()+10;
    //set intervals for different planes;
    var intT = 1;
    var intL = 5;
    var intR = 8;
    var intS = 0.7;
    //set alpha value variable
    var alphaV = 0;

    //draw base plane (black) with no outlines;
    topPlane(width*2/3-50,height*3/4,90,100,"black",false);
    leftPlane(width*2/3-50,height*3/4,90,5,'#FFB11B',false);
    rightPlane(width*2/3-50,height*3/4,5,100,'#FFC408',false);

    //draw top planes that increment every second; resets after a cycle of 60
    for (var i=0; i<sec; i++){
        topPlane(cX,cY,40,intT,'#985F2A',false)
        cX = cX + intT/cos(45);
        cY = cY - intT/cos(45);
    }

    //draw left planes that increment every minute; resets after a cycle of 60
    for (var i=0; i<min; i++){
        leftPlane(lX,lY,40,intL,"white",false);
        lY += intL;
    }

    //draw right planes that increment every hour; resets after a cycle of 24
    var len = dist(width/2,height/2,cX,cY);
    for (var i=0; i<hr; i++){
        rightPlane(rX+4, rY+8,intR,60,"red",false);
        rY += intR;
    }

    //draw edge planes that compose the three dimensional image
    leftPlane(width/2+4,height/2+8,2,intR*hr,25,false);
    topPlane(width/2+4,height/2+8,2,60,200,false);

    rightPlane(width/2,height/2,7,intT*sec,55,false);

    //draw side planes that increments every second; resets after a cycle of 60
    for (var i=0; i<sec; i++){
        var dis = min*intL-107;
        rightPlane(sX,sY,dis,intS,'#005CAF',false);
        sX -= intS/cos(45);
        sY += intS/cos(45);
    }
    //draw side plane Edge
    var edgeLen2 = intS*sec;
    topPlane(sX+intS/cos(45),sY-intS/cos(45),2,edgeLen2,45,false);
    leftPlane(sX+intS/cos(45), sY-intS/cos(45),2,dis,"black");

    //dim the background every second;
    alphaV += sec%59 * 3;
    noStroke();
    fill(0,0,0,alphaV);
    rect(0,0,width,height);

}

function topPlane (cX, cY, side1, side2, color,outline){
    var p1X = cX - side1/cos(45);
    var p1Y = cY - side1/cos(45);
    var p2X = p1X + side2/cos(45);
    var p2Y = p1Y - side2/cos(45);
    var p3X = cX + side2/cos(45);
    var p3Y = cY - side2/cos(45);
    fill(color);
    if (outline == false){
        noStroke();
        quad(cX, cY, p1X, p1Y, p2X, p2Y,p3X, p3Y);
    }
    else{
        stroke(0);
        quad(cX, cY, p1X, p1Y, p2X, p2Y,p3X, p3Y);
    }
}

function leftPlane (cX, cY, side1, side2,color,outline){
    var p1X = cX;
    var p1Y = cY + side2;
    var p2X = p1X - side1/cos(45);
    var p2Y = p1Y - side1/cos(45);
    var p3X = cX - side1/cos(45);
    var p3Y = cY - side1/cos(45);
    fill(color);
    if (outline == false){
        noStroke();
        quad(cX, cY, p1X, p1Y, p2X, p2Y,p3X, p3Y);
    }
    else{
        stroke(0);
        quad(cX, cY, p1X, p1Y, p2X, p2Y,p3X, p3Y);
    }
}

function rightPlane (cX, cY, side1, side2, color,outline){
    var p1X = cX;
    var p1Y = cY + side1;
    var p2X = p1X + side2/cos(45);
    var p2Y = p1Y - side2/cos(45);
    var p3X = cX + side2/cos(45);
    var p3Y = cY - side2/cos(45);
    fill(color);
    if (outline == false){
        noStroke();
        quad(cX, cY, p1X, p1Y, p2X, p2Y,p3X, p3Y);
    }
    else{
        stroke(0);
        quad(cX, cY, p1X, p1Y, p2X, p2Y,p3X, p3Y);
    }
}

The inspiration for the visual style of this project came from the drawings of Theo Van Doesburg, a De Stijl artist during the 1900s.
I am interested in the idea of representing the change of time with the change of space. By extending the length size of the planes, the spatial quality of the representation changes throughout the day.
Also for legibility, I set the cycle of the dimming of the background color to be every minute.

ShanWang-LookingOutwards-06

steven_keating_1

(Silk Pavillion Installed)

Silk Pavillion is not just a bold architectural attempt, but an “exemplary combination” of scientific research, digital design and biomimetic construction by the MIT Media Lab’s Mediated Matter Group.

The project is compelling in its thorough research in silkworms’ interaction in different three dimensional spaces.The design of the primary structure was very carefully executed with robot-woven threads wrapping a steel frame. Mimicking the formation of cocoon, the pavillion was however created with a certain extent of parametric control in the basic level and with the randomness of the silk pattern produced by 6400 silkworms.

I found the Silk Pavilion to be of great importance because it opens up potentials in the collaboration among biology, information system and architecture, and it’s fascinating how the insects instinctive behavior can create functional space for human beings.

steven_keating_4

(silkworms weaving the pavilion)

ShanWang-Project5-WallPaper

In this project, I got inspiration from the patterns on blue and white pottery from China. By making a function that draws each module, generating multiple patterns became relatively easy.

sketch

//Shan Wang
//Section A
//shanw1@andrew.cmu.edu
//Assignment-05-Project


function setup() {
    createCanvas(700, 480);
    background("white");
}
function lockSpiral(cenX,cenY,unitLen,degree,weight){
    var startX = cenX;
    var startY = cenY;
    var len = unitLen
    for (var i=0; i<degree;i++){
        stroke(30,30,129);
        strokeWeight(weight);
        if ((i+1)%4 == 1){
            line(startX,startY,startX-len,startY);
            startX = startX-len
        }
        if ((i+1)%4 == 2){
            line(startX,startY,startX,startY+len);
            startY = startY+len
            len += unitLen
        }
        if ((i+1)%4 == 3){
            line(startX,startY,startX+len,startY);
            startX = startX+len
        }
        if ((i+1)%4 == 0){
            line(startX,startY,startX,startY-len);
            startY = startY-len
            len += unitLen
        }
    }
}
function cloud(cenX,cenY,largestR,unitR,num){
    for (var i = 0; i<num; i++){
        if (i%2 == 0){
            //fill("white")
            fill(30,30,129);
            arc(cenX,cenY,largestR-i*unitR,largestR-i*unitR,PI,TWO_PI,CHORD);
        }
        if (i%2 == 1){
            //fill(30,30,129);
            fill("white");
            arc(cenX,cenY,largestR-i*unitR,largestR-i*unitR,PI,TWO_PI,CHORD);
        }
    }
}

function draw() {
    noLoop();
    //draw spiral pattern
    var intervS = width/30;
    var spiralSize = width/60;

    for (var i=0; i<20; i++){
        lockSpiral((i+1)*intervS+i*spiralSize-5,height/2,5,13,2.5);
    }

    for (var i=0; i<10;i++){
        lockSpiral((i+1)*intervS*2+i*spiralSize*2-10,height/2+50,10,13,4);
    }
    for (var i=0; i<20;i++){
        lockSpiral((i+1)*intervS+i*spiralSize-5,height/2+100,5,13,2.5);
    }

    for (var i=0; i<20; i++){
        lockSpiral((i+1)*intervS+i*spiralSize-5,height/4+15,5,13,2.5);
    }

    for (var i=0; i<20; i++){
        lockSpiral((i+1)*intervS+i*spiralSize-5,50,5,13,2.5);
    }


    //draw wave pattern
    var intervC = width/60;
    var arcSizeS = 40;
    var arcSizeB = 60;
    for (var i=0; i<13; i++){
        noStroke();
        cloud((i+1)*intervC+i*arcSizeS+arcSizeS/3,height,50,7,8);
    }
    for (var i=0; i<13; i++){
        noStroke();
        cloud((i+1)*intervC+(i+1)*arcSizeS,height,50,7,8);
    }

    for (var i=0; i<10; i++){
        noStroke();
        cloud((i+1)*intervC+i*arcSizeB+arcSizeB/3,height/2-20,60,9,9);
    }
    for (var i=0; i<10; i++){
        noStroke();
        cloud((i+1)*intervC+(i+1)*arcSizeB,height/2-20,60,9,9);
    }

    push();
    for (var i=0; i<26; i++){
        translate((i+1)*intervC+(i+1)*arcSizeS,height*3/4);
        rotate(PI);
        cloud(0,0,60,9,9);
    }
    pop();

    push();
    for (var i=0; i<26; i++){
        translate((i+1)*intervC+i*arcSizeS+arcSizeS/3,height*3/4);
        rotate(PI);
        cloud(0,0,60,9,9);
    }
    pop();

    //draw linear pattern
    stroke(30,30,129);
    strokeCap(SQUARE);
    strokeWeight(5);
    line(0,height*4/5+18,width*2/3,height*4/5+18);
    line(width*2/3+15,height*4/5+18,width,height*4/5+18);

    strokeWeight(30);
    line(0,height*4/5+40,width*2/3,height*4/5+40);
    line(width*2/3+15,height*4/5+40,width,height*4/5+40);

    strokeWeight(3);
    line(0,height*12/13, width*2/3,height*12/13);
    line(width*2/3+15,height*12/13, width,height*12/13);

    strokeWeight(10);
    line(0,height/3,width/3,height/3);
    line(width/3+10,height/3,width,height/3);

    strokeWeight(40);
    line(0,height/5-5,width/3,height/5-5);
    line(width/3+10,height/5-5,width,height/5-5);

    strokeWeight(3);
    line(0,10, width*2/3,10);
    line(width*2/3+15,10, width,10);

    strokeWeight(8);
    line(0,20, width*2/3,20);
    line(width*2/3+15,20, width,20);

}

ShanWang-LookingOutwards-05

exeter1_900_00071Computer Generated Graphic of Louis Khan’s library in Exeter

The Third and the Seventh project created by Alex Roman is stunning in its aesthetic sensibility and the techniques used in the process of the generation. As the man behind some of the greatest architecture visualizations of all time, Alex is an CG artists3 who utilizes DSMax and V-Ray for rendering, Photoshop for texture work, AfterEffects for compositing and color grading and Adobe Premiere for edit it all.

What’s really fascinating about this project is the fact that every frame was computer generated, and because of Alex’s incredible sensibility about lighting, shades and color, series of images arouse profound 3 dimensional, spatial feelings in a 2 dimensional display.

ShanWang-Project-04-String-Art

In this project I first tried to create a gradient background with layers of lines like a spider web. Then I modified the code so that the central group of lines are accentuated with greater stroke weights.
At last, I created two groups of lines on the top left and down right corner of the canvas to give the entire composition a sense of enclosure.

sketch

//Shan Wang
//Section A
//shanw1@andrew.cmu.edu
//Project-04

var ref1Size; //size of gap for reference 1
var color;
var colorControl = 30;
var weight;
var ref1Control = 3.5;
var ref2Control = 1.5;
var weightControl = 16;
var interval1 = 10;
var interval2 = 15;

function setup() {
    createCanvas(640, 480);
    c1 = color(200, 219, 216);
    c2 = color(99,112,145);
}
// create the function that generates the gradient
function gradient(x,y,wid,hei,c1,c2){
    noFill();
    for (var i = x; i<x+wid; i++){
        var inter = map(i,x,x+wid,0,1);
        var col = lerpColor(c1,c2,inter);
        stroke(col);
        line(i,y,i,y+hei);
    }
}
function draw() {
    noLoop();
    weight = 0.2;
    color = 220;
    ref1Size = width/80;
    //create background gradient
    gradient(0,0,width,height,c1,c2);
    //create background grid patterns and accentuate the shape in the middle
    //use nested loop to generate multiple curves
    for (var i = 1; i<7; i++){
        for (var a = 0; a<18; a++){
            if (i%4 == 4){
                color += colorControl*1.5;
                weight -= 0.01*weightControl;
                ref1Size += 0.5;
            } else if (i%4 == 3){
                color += colorControl*0.5;
                weight -= 0.03*weightControl;
                ref1Size += 2;
            } else if (i%4 == 2){
                color += colorControl*0.3;
                weight = 0.015*weightControl;
                ref1Size += 0.5;
            } else if (i%4 == 1){
                color += colorControl*0.5;
                weight += 0.002*weightControl;
                ref1Size -= 0.5;
            } else {
                color += colorControl;
                weight += 0.008*weightControl;
                ref1Size += 0.5;
            }
            strokeWeight(weight);
            stroke(color,color,color);
            line(0,(i+1)*ref1Size*ref1Control*0.75,width,height-(a+1)*ref1Size*ref2Control);
        }
    }
    //draw partial web on the top left corner
    for (var i = 0; i<40;i++){
        stroke(color+i*5);
        strokeWeight(0.4);
        line(0,height/2-interval1*i,i*interval1,0);
    }
    //draw partial web on the down right corner
    for (var i = 0; i<70;i++){
        stroke(color+i);
        strokeWeight(0.3);
        line(i*interval2,height,width,height-interval2*i*2);
    }
}

ShanWang-LookingOutwards-04

patternreel

(sample codes for Spicule)

Created by Alex McLean, Spicule is a album released as a Pi Zero with high quality  DAC in customs case that allows users to remix or rework the music using the TidalCycles live coding environment. The artist created the free and open source software TidalCycles with some friends, where users can join life streaming sessions and watch how he built up the rhythm and patterns with code. Different beats and sound of instruments are generated base on the code, which give users freedom to play with, experiment and create the unique music of their own.

I found the project extremely fascinating because of the unlimited possibilities it provides. With parametric control over sounds in its very basic unit (pitch, rhythm and etc.), access to music composition and experiments would no longer be limited to the small crowd.

(live of Alex McLean)

ShanWang-Project-03-Dynamic-Drawing

Slide the mouse left to right to change the color and the size of the circles.

Slide the mouse up and down to change the speed of the rotation.

In this project I created a series of circles that rotates around the previous one.

The color, size and therefore position of the circles are controlled by the change in x coordinate of the mouse.
The speed of rotation is controlled by the the change in y coordinate of the mouse.

sketch

//Shan Wang
//Section A
//shanw1@andrew.cmu.edu
//Assignment-03-Project


var radius1 = 200
var angle1 = 0
var angle2 = 0
var angle3 = 0
var angle4 = 0
var angle5 = 0
var angle6 = 0
var angle7 = 0
var angle8 = 0
var angle9 = 0
var angle10 = 0
var speed = 128
var fillColor = 0


function setup() {
    createCanvas(480,600);
}

function mousePressed(){
    if (width/2-radius1 <= mouseX <= width/2+radius1){
        bgColor = 255-bgColor
    }
}
 
function draw() {
    background(255);
    noStroke();

    //control the speed of spining with the change in y coordinate of the mouse
    speed = map(mouseY,0,height,64,192);

    //control the color of circles with the change in x coordinate of the mouse
    bgColor = map(mouseX,0,width,0,255);

    //control the size of all the circles with the change in x coordinate of the mouse
    radius1 = map(mouseX,0,width,100,200);

    //position of first big circle
    var cenX1 = width/2;
    var cenY1 = height/2;
    fill(bgColor);
    ellipse(cenX1, cenY1, radius1*2, radius1*2);

    //draw second circle
    translate(cenX1,cenY1);
    fill(255-bgColor);
    angle1 += PI/speed;
    var radius2 = 2/3*radius1;
    var dis2 = radius1 - radius2;
    var cenX2 = dis2*cos(angle1);
    var cenY2 = dis2*sin(angle1);
    ellipse(cenX2, cenY2,radius2*2, radius2*2);

    //draw third circle
    translate(cenX2,cenY2);
    fill(bgColor);
    angle2 += PI/(0.5*speed);
    var radius3 = 2/3*radius2;
    var dis3 = radius2 - radius3;
    var cenX3 = dis3*cos(angle2);
    var cenY3 = dis3*sin(angle2);
    ellipse(cenX3, cenY3, radius3*2,radius3*2);

    //draw 4th circle
    translate(cenX3,cenY3);
    fill(255-bgColor);
    angle3 += PI/((0.5*speed));
    var radius4 = 2/3*radius3;
    var dis4 = radius3 - radius4;
    var cenX4 = dis4*cos(angle3);
    var cenY4 = dis4*sin(angle3);
    ellipse(cenX4, cenY4, radius4*2,radius4*2);

    //draw 5th circle
    translate(cenX4,cenY4);
    fill(bgColor);
    angle4 += PI/(0.4375*speed);
    var radius5 = 2/3*radius4;
    var dis5 = radius4 - radius5;
    var cenX5 = dis5*cos(angle4);
    var cenY5 = dis5*sin(angle4);
    ellipse(cenX5, cenY5, radius5*2,radius5*2);


    //draw 6th circle
    translate(cenX5,cenY5);
    fill(255-bgColor);
    angle5 += PI/(0.375*speed);
    var radius6 = 2/3*radius5;
    var dis6 = radius5 - radius6;
    var cenX6 = dis6*cos(angle5);
    var cenY6 = dis6*sin(angle5);
    ellipse(cenX6, cenY6, radius6*2,radius6*2);

    //draw 7th circle
    translate(cenX6,cenY6);
    fill(bgColor);
    angle6 += PI/(0.25*speed);
    var radius7 = 2/3*radius6;
    var dis7 = radius6 - radius7;
    var cenX7 = dis7*cos(angle6);
    var cenY7 = dis7*sin(angle6);
    ellipse(cenX7, cenY7, radius7*2,radius7*2);

    //draw 8th circle
    translate(cenX7,cenY7);
    fill(255-bgColor);
    angle7 += PI/(0.125*speed);
    var radius8 = 2/3*radius7;
    var dis8 = radius7 - radius8;
    var cenX8 = dis8*cos(angle7);
    var cenY8 = dis8*sin(angle7);
    ellipse(cenX8, cenY8, radius8*2,radius8*2);

    //draw 9th circle
    translate(cenX8,cenY8);
    fill(bgColor);
    angle8 += PI/(0.125*speed);
    var radius9 = 1/2*radius8;
    var dis9 = radius8 - radius9;
    var cenX9 = dis9*cos(angle8);
    var cenY9 = dis9*sin(angle8);
    ellipse(cenX9, cenY9, radius9*2,radius9*2);

    //draw 10th circle
    translate(cenX9,cenY9);
    fill(255-bgColor);
    angle9 += PI/(0.125*speed);
    var radius10 = 1/2*radius9;
    var dis10 = radius9 - radius10;
    var cenX10 = dis10*cos(angle9);
    var cenY10 = dis10*sin(angle9);
    ellipse(cenX10, cenY10, radius10*2,radius10*2);

    //draw 11th circle
    translate(cenX10,cenY10);
    fill(bgColor);
    angle10 += PI/(0.25*speed);
    var radius11 = 1/2*radius10;
    var dis11 = radius10 - radius11;
    var cenX11 = dis11*cos(angle10);
    var cenY11 = dis11*sin(angle10);
    ellipse(cenX11, cenY11, radius11*2,radius11*2);

}

ShanWang-LookingOutwards-03

7d517913144003-562711b5b8664

The Parametric bench is one of the elements the collection of “Parametric furnitures”. Oleg Soroko crafted the project in 2014 with 18mm plywood sections that were fasten with iron rods, wound on the mounting bolts. The high-quality wood material, the waterproof varnish, the curvatures and the fact that the entire piece was composed by sections, all together generated a dynamic form that emphasized the shape of the bench better than a whole piece of solid wood would do.
Since there is no specification on the algorithms used by the artist for this bench, I looked into his other projects and found that in a similar project that accentuates the curve patterns used “gradient descent”, “marching cubes” algorithms as well as scripting in Rhinoceros. I suppose that he took similar approach in this project. The precise cut of the sections can be generated in Rhino through relatively simple and fast commands.
It is a relatively easy and inexpensive way of prototyping, and I can see its application in greater fields other than furniture design, such as architectural model and industrial design.

https://www.behance.net/gallery/18982743/Curve-descent-pattern