zhuoyinl-Looking outward

1

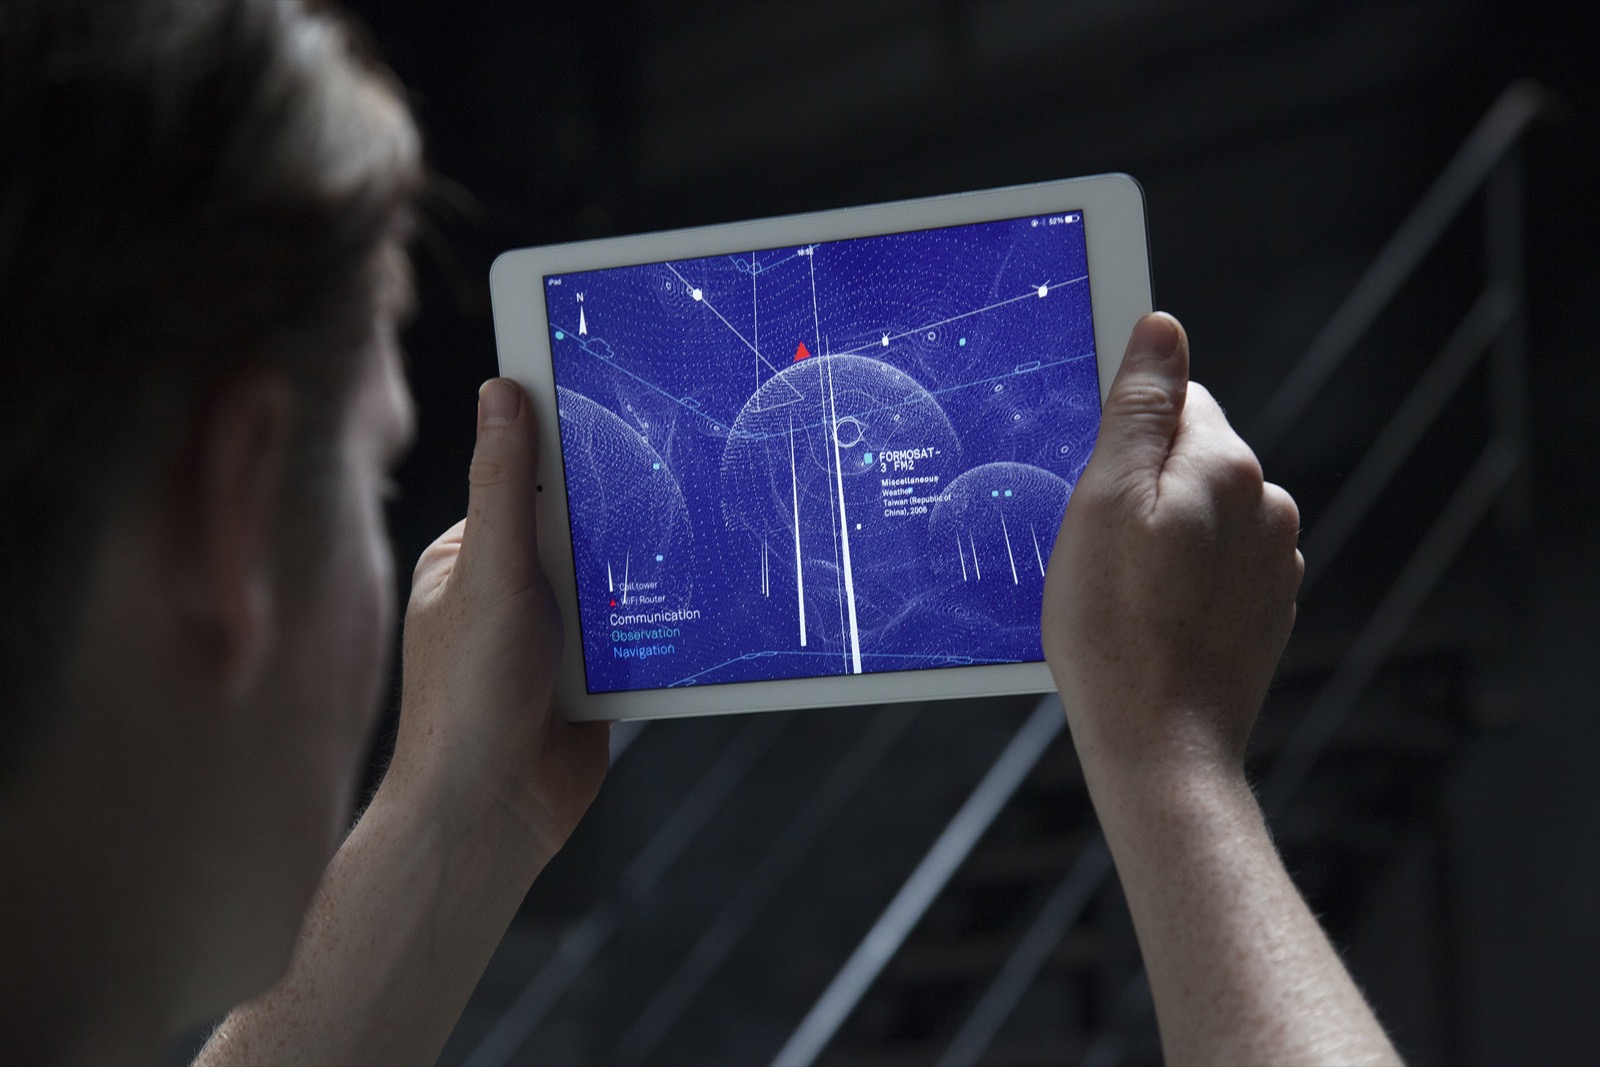
This is an app created by Richard Vijgen, called Architecture of Radios. It visualized the network of electric signals around the earth like cell towers, WiFi routers and navigations by using dots to create curves and use density of the dots to represent signal strength. By making the invisible signals visible while hiding the visible buildings, people could interact with the landscape they are located.

2

I found this project especially inspiring because the inventor using modern technology and data visualization to change the way people usually think of architecture. With in such trend, the concept of architecture would profoundly change into a brand new data information field and from that, I see the future.

zhuoyinl-project07

sketch
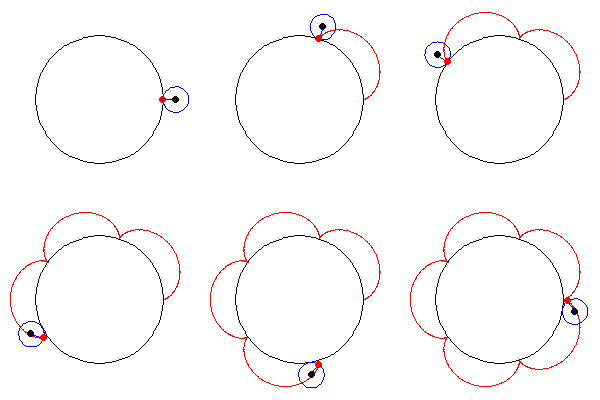
I tried to use curve to depict a flower shapes with the change of color gradients.I used the curve equation from the site below.

//zhuoying Lin
//section a 
//zhuoyinl
//Project 07-composition with curves

var nPoint = 100;

function setup() {
    createCanvas(400, 400);
}

function draw() {
    var colG = map(mouseX, 0, height, 180,140);
    background(255, colG, colG+mouseY*0.1);//make background change with curve
   
    for (var i= 0; i<10; i++) {
        var col = map(i, 0, 10, 100,200);//chaneg curve color
        stroke(col);
        strokeWeight(1);
        noFill();
        drawFourarcs(i*30, mouseY,i);
    }    
}

function drawFourarcs (x,y,r) {//draw curve

    push();
    translate(width/2, height/2);
    var x;
    var y;
    var r;
    var a = map(mouseY, 0, width, 1, 20);// size of pattern
    var n = map(mouseX, 0, height, 1,15)//division

    beginShape();
    for (var i = 0; i<nPoint; i++) {
        var t = map (i, 0, nPoint, 0, TWO_PI);
        x = (a/r)*(n*cos(t)-cos(n*t));
        y = (a/r)*(n*sin(t)-sin(n*t));
        vertex(x,y);
    }
    endShape(CLOSE);
    pop();

}

reference

zhuoyinl-project 06 abstruct clock

sketch

//Zhuoying Lin
//section a
//zhuoyinl@andrew.cmu.edu
//Project 06 abstruct clock

var xh = [];
var yh = [];
var xb = [];
var yb = [];
var col = [];


function setup() {
    createCanvas(600, 600);
    for (i = 0; i<100; i++) {
        xh[i] = random(50,550);
        yh[i] = random(50,550);
        xb[i] = random(0,600);
        yb[i] = random(0,600);
        col[i] = random(150,255);
    }
    frameRate(4);
}

function draw() {
    background(0);
    var h = hour();
    var m = minute();
    var s = second();

    push();
    translate(width/2, height/2);

    for (i = 0; i<s;i++) {
         stroke(col[i]);
         strokeWeight(0.5);
         noFill();
         ellipse(0, 0, 540-i*9, 540-i*9);//the decreasing circle in thebackground which represent seconds

    }
    pop();
    
    push();
    translate(width/2, height/2);
    for ( i = 0; i<m; i++) {

       
        rotate(radians(6));
        stroke(col[i]);
        strokeWeight(3);
        line(0, 0, 0, -290+random(-3,3));      
    }
    pop();//the amount of lines representing the minute

    for (i = 0; i<s; i++) {
        fill(random(0,255));
        noStroke();
        ellipse(xb[i], yb[i], 10, 10);
    }//draw the shining stars in the background, the amount is in relation to second

    push();
    translate(width/2, height/2);
    var angle = 360*s/60
    rotate(radians(angle-90));//make the circle of epplipse rotate according to seconds
    for (i = 0; i<h; i++) {
        rotate(radians(15));
        noStroke();
        fill(col[i]);
        ellipse(0, -258, 25,25);//number of circles which representing hours
    }
    pop();

    textFont("Helvetica")
    text(nf(h,2,0)+":", 535, 590);
    text(nf(m,2,0)+":", 555, 590);
    text(nf(s,2,0), 575,590);
   
}

For this project, I try to create a sense of universe to depict the fourth dimension. And I used multiple variables to represent the time move. Both the circle lines and circle of ellipses represent the time in second as a metaphor of planets in the space and their tracks. The number of long white lines represent the minutes which could also seen as light beam and the number of while ellipse represent the hours. The sparkly little ellipse in the background do not show the times but they could be seen as stars far away.

sketch

Looking outwards06

VILLA from Malevo on Vimeo.

This project called VILLA means error in Icelandic. It is a visual identity video for the REYKJAVIK VISUAL MUSIC PUNTOY
RAYA FESTIVAL. The video is fundamentally based on idea of creating error over black and white clean dot and line motion graphics work. The distortion is made by series of digital glitches through the image and only uses pure dots, lines, colors, motion and sound, and gradually they lose their original quality. However, through the distortion, the image gains new texture and beauty. In this way, the computational art using randomness visually explained the power of expressionism and the way it transform.

zhuoyinl- project05 wallpaper

wallpaper.js

//Zhuoying Lin
//section a 
//zhuoyinl@andrew.cmu.edu
//project

function setup() {
    createCanvas(600, 700);
    
}


function draw() {
    background(240);

    //monster
    var mx = random(-50,100);//origin x
    var my = random(30,100);//origin y
    var sy = 200;//y spacing
    var sx = 200;//x spacing
    for (var y = 0; y<7; y++) {
        if (y%2==0) {
            for (var x = 0; x<5; x++) {
                monster(mx+x*sx, my+y* (sy*sqrt(3)/2));
            }
        } else {
            for (var x = 0; x<5; x++) {
                monster(mx+sx/2+x*sx, my+y* (sy*sqrt(3)/2));
            }
        }
    }
    noLoop();

    //duck
    var dx = random(0,50);//origin x
    var dy = random(30,50);//origin y
    var sy = 150;//y spacing
    var sx = 250;//x spacing
    for (var y = 0; y<7; y++) {
        if (y%2==0) {
            for (var x = 0; x<5; x++) {
                duck(dx+sx/2+x*sx, dy+y* (sy*sqrt(3)/2));
            }
        } else {
            for (var x = 0; x<5; x++) {
                duck(dx+x*sx, dy+y* (sy*sqrt(3)/2));
            }
        }
    }
    noLoop();

}

function monster(mx, my) {//draw monster
    push();
    translate(mx, my);
    stroke(137,78,115);
    strokeWeight(5);
    line(25, -25, 25, 0);//ear1
    line(45, -25, 35, 0);//ear2
    line(30, 30, 85, 40);//tail
    stroke(244,179,220);
    strokeWeight(30);
    line(10, 0, 50, 0);//monster head
    strokeWeight(5);
    line(35, 40, 35, 60);//foot1
    line(45, 40, 45, 60);//foot2
    line(55, 40, 55, 60);//foot3
    line(65, 40, 65, 60);//foot4
    strokeWeight(50);
    line(50, 10, 50, 30);//monster body
    fill(255);
    noStroke();
    ellipse(22, 0, 15, 15);//left eye
    ellipse(42, 0, 15, 15);//right eye
    fill(0);
    noStroke();
    ellipse(20, 0, 5, 5);//eyeball1
    ellipse(40, 0, 5, 5);//eyeball2
    pop();
}

function duck(dx, dy) {//draw duck
    push();
    translate(dx, dy);
    stroke(255, 183, 0);
    strokeWeight(5);
    line(-15, 60, -15, 85);//foot1
    line(-5, 60, -5, 85);//foot2
    stroke(154, 231, 217);
    strokeWeight(40);
    line(0, 0, 0, 30);//neck
    strokeWeight(40);
    line(-30, 40, 0, 40);//body
    strokeWeight(10);
    line(-55, 40, -30, 40);//tail
    stroke(255, 183, 0);
    strokeWeight(7);
    line(10, 7, 25, 7);//mouse
    line(10, 14, 25, 14);//mouse
    fill(255);
    noStroke();
    ellipse(0, 0, 10, 10);//eye
    fill(0);
    noStroke();
    ellipse(1, 0, 5, 5);


    pop();
}


For this wallpaper, I used ‘random’ command to generate a little bit different patterns each time it is opened, and I tried to make the grid hexagon to add some interest to the grid.

sketch

zhuoyinl-Looking Outwards

day time

night

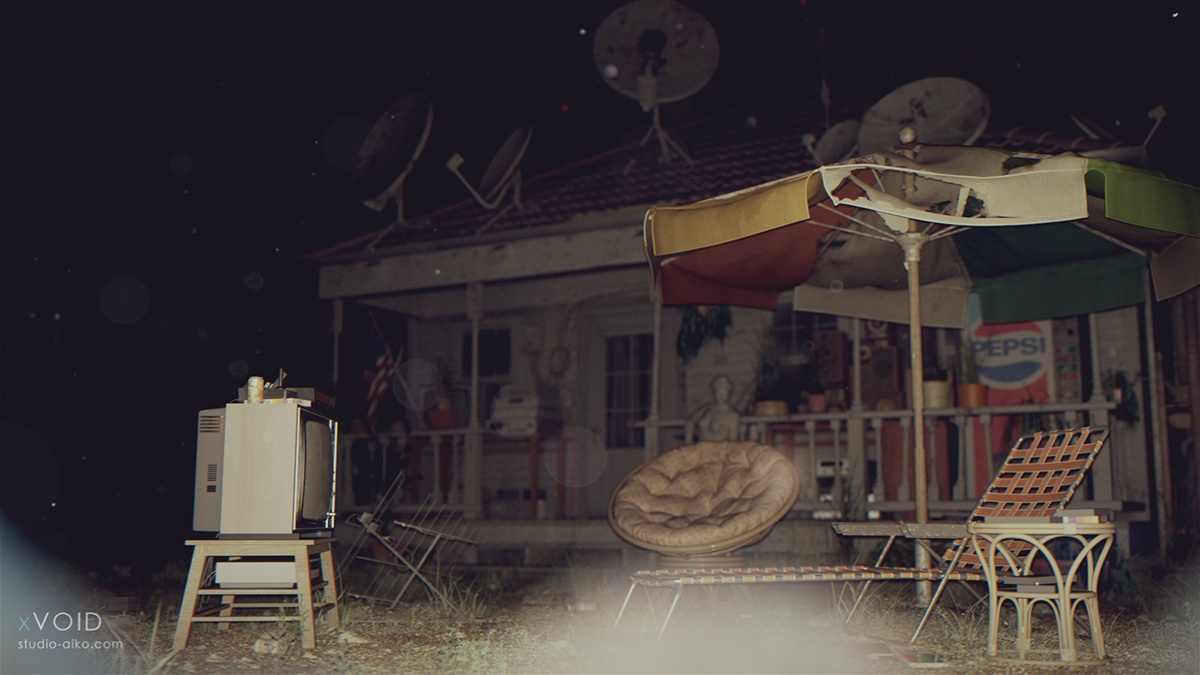
These Hyper-Realistic 3D computer graphic rendering is inspired by sci-fi and horror films and from locations of abandoned places which could be a great environment for making film story lines to occur. It is made by xVOID studio. They made around 14140 objects in the scene and used art CG 3D software such as 3D Studio Max, VRay, MODO, ZBrush, and Marvelous Designer. I found this project amazing because it simulate the environment so detailed, and they made 3D models to create this scene so that it could render scenes in different condition and viewer could get a 360 view of the objects. I found this extremely smart because in the architecture field, the simulation and graphic indication for clients is significantly important and such way of indication is rather comprehensive and impressive. For architecture student like me, 3D Max and VRay is no strangers but the way the author using different images and materials to render objects is amazing.

zhuoyinl-project04

my-sketch.js


function setup() {
  createCanvas(640, 480);
}

function draw() {
  background('lightpink');

//blue lines
  for (i = 0; i < 50; i++) {
    x1 = 0;
    y1 = 480;
    x2 = 0;
    y2 = 0;

    x1+= (i*60);
    y1+= (i*5);
    y2+= (i*20);
    stroke('lightblue');
    strokeWeight(1);
    line(x1, y1, x2, y2);
  }

//yellow lines
  for (i = 0; i<50; i++) {
    x1 = 640;
    y1 = 480;
    x2 = 640;
    y2 = 240;

    x1-= (i*20);
    y1+= (i*1);
    x2+= (i*2);
    y2+= (i*10);

    stroke(255, 240, 1);
    strokeWeight(1);
    line(x1, y1, x2, y2);

  }

//grey lines
for (i = 0; i<50; i++) {
    x1 = 320;
    y1 = 0;
    x2 = 640;
    y2 = 0;

    x1+= (i*16);
    y2+= (i*15);

    stroke(159, 150, 141);
    strokeWeight(1);
    line(x1, y1, x2, y2);

  }

//green lines
for (i = 0; i<50; i++) {
    x1 = 640;
    y1 = 0;
    x2 = 640;
    y2 = 480;

    x1-= (i*39);
    y1-= (i*5);
    y2-= (i*10);

    stroke(154, 231, 217);
    strokeWeight(1);
    line(x1, y1, x2, y2);

  }

//purple lines
for (i = 0; i<50; i++) {
    x1 = 0;
    y1 = 0;
    x2 = 0
    y2 = 240;

    x1+= (i*16);
    y2-= (i*10);

    stroke(193, 155, 223);
    strokeWeight(1);
    line(x1, y1, x2, y2);

  }
  

//pink lines
for (i = 0; i<50; i++) {
    x1 = 0;
    y1 = 240;
    x2 = 0
    y2 = 480;

    x1-= (i*3)
    y1+= (i*15);
    x2+= (i*20);
    y2-= (i*.01)

    stroke(250, 104, 127);
    strokeWeight(1);
    line(x1, y1, x2, y2);
  }

  //dark green lines
  for (i = 0; i < 50; i++) {
    x1 = 640;
    y1 = 0;
    x2 = 0;
    y2 = 0;

    x1-= (i*30);
    y1+= (i*.1);
    x2+= (i*.1);
    y2+= (i*25);
    stroke(155, 183, 212);
    strokeWeight(1);
    line(x1, y1, x2, y2);
  }

  //light grey lines
  for (i = 0; i < 50; i++) {
    x1 = 0;
    y1 = 480;
    x2 = 640;
    y2 = 480;

    x1+= (i*30);
    y1+= (i*.1);
    x2+= (i*.1);
    y2-= (i*25);
    stroke(209, 190, 199);
    strokeWeight(1);
    line(x1, y1, x2, y2);
  }
  
}

I used multiple grids along the edges of the canvas to create the pattern. The different color creating a depth to the pattern.

zhuoyinl-Lookingoutwards4

MIDI

This project is a portable, autO-powered MIDI controller that boots up into a variety of apps to integrate events with sounds. It indicates the sound and waves through the lights under the buttons which is inspired by both the monomer and tenori-on. By using loops in programming the apps, the inventor was able to visualize the sound played within the MIDI and control the output from the reinvent device with simple movement variables. The idea is inspiring to me because it visualized the acoustic field which is being overlooked by many people and making interaction with the invisible sound wave possible by cheaper and more accessible device.

zhuoyinl-Project-03

my-sketch.js

//Zhuoying Lin
//section A
//zhuoyinl@andrew.cmu.edu
//project03


function setup() {
    createCanvas(640, 480);
}

function draw() {
	background('lightPink');

	//box
	fill(255-(0.1*mouseX));
	noStroke();
	rect(0, 400-(0.75*mouseX), 0.125*mouseX, 0.125*mouseX);
	rect(mouseX, 0, 0.125*mouseX, 0.125*mouseX);
	rect(560-mouseX, 400, 0.125*mouseX, 0.125*mouseX);
	rect(560, 0.75*mouseX, 0.125*mouseX, 0.125*mouseX);

	//circles
	push();
	fill(255-(0.5*mouseX));
	noStroke();
	translate(320, 240);
	rotate((millis())/(mouseX*10));
	ellipse(-50, 0, 100, 100);
	fill(0+(0.5*mouseX));
	ellipse(50, 0, 100, 100);
	pop();

}

I tried to make some uniformed variables that changing with mouse movement and form a pattern. Here is my solution.

zhuoyinl looking outward 03

brick
Those polybrick use digital technology like three dimensional printing, and advanced shapes and different material. It is an ongoing project in the Sabin Design at Cornell Architecture. The project makes use of algorithmic design techniques to make those nonstandard ceramic bricks and then fired them into stable shapes. By using digital data to control the shaping of clays from the earth, people are able to make dynamic wall shapes and facades like this with low cost printing materials. Also this kind of brick could be highly customized and spread across the field. I found this project especially interesting because it digs into the possibility of future architectural structures and creates a brand new way to think of customized building materials. What’s more, the hollow structure of each brick gives the material more possibility in environmental aspect.

Link: