![[OLD FALL 2017] 15-104 • Introduction to Computing for Creative Practice](https://courses.ideate.cmu.edu/15-104/f2017/wp-content/uploads/2020/08/stop-banner.png)
var mouse_x;

function setup() {
    createCanvas(480, 480);
}

function draw() {
    background(50);
    var x;
    var y;

    // limit the mouseX only works in canvas
    if(mouseX<width & mouseX >0){
        mouse_x = mouseX;
    } else if (mouseX<=0){
        mouse_x = 0;
    } else{
        mouse_x = width;
    }

    // http://mathworld.wolfram.com/Deltoid.html
    // mapping the b from 0 to 480 into from 0 to 30,
    // and since b is the radius of the small circle, make it relate to
    //mouse X can change the scale of the curves.
    var b = map(mouse_x, 0, width, 0, 30);

    for (var i = 1; i <= 20; i++) {
        push();
        //put the whole thing in the center of the canvas and make it shake
        translate(width/2+random(-5,5), height/2+random(-5,5));
        //change mouseX also affect the rotation of the shapes
        var rotateAng = map(mouse_x, 0, width, 0, TWO_PI)
        //make the rotation more obvious
        rotate(rotateAng + i*3);
        //make the stroke weight become less according to the number of shape
        strokeWeight(8/i);
        noFill();
        //make the stroke color of circles randomlmy change
        stroke(random(20,100),random(10,130),random(50,100)
            ,400/i);
        ellipse(0,0,6*i*b,6*i*b);
        //call the function to draw curves
        DrawCurves(i * b);
        pop();
    }
}

function DrawCurves(R) {
    //map the color change into a range as the mouseX is changing
    var red = map(mouse_x, 0, width, 10, 20);
    var green = map(mouse_x, 0, width, 10, 15);
    var blue = map(mouse_x, 0, width, 10, 20);

    fill(red*random(4, 7), green*random(11,12),blue*random(6,15));
    //draw curves according to the parametric equations
    for (var i = 0; i < 360; i++) {
        var t = radians(i);
        x = 2 * R * cos(t) + R * cos(2 * t);
        y = 2 * R * sin(t) - R * sin(2 * t);
        beginShape(POINTS);
        vertex(x, y);
        endShape();
    }
}
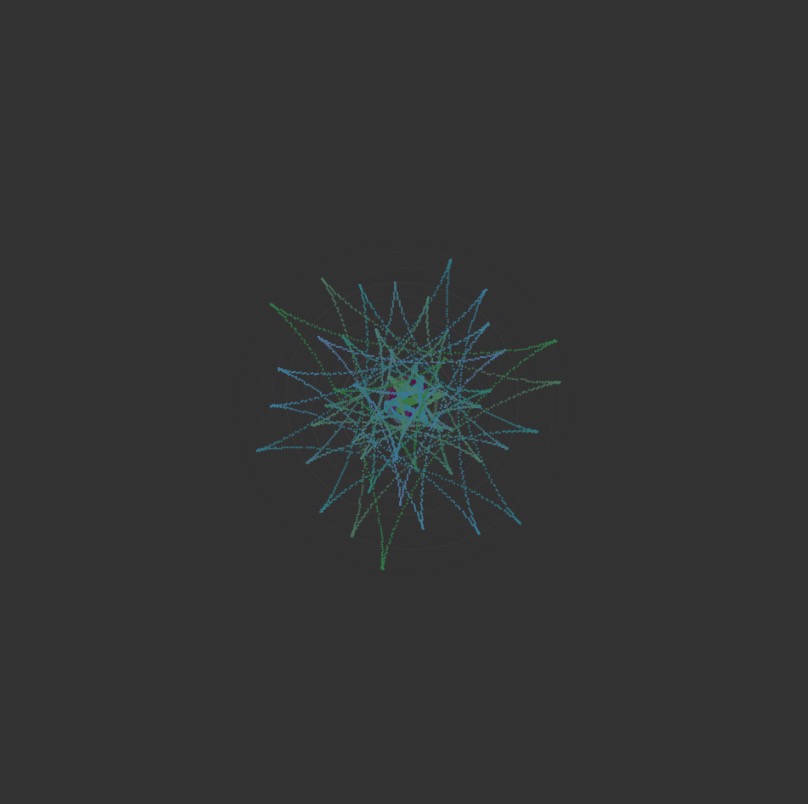
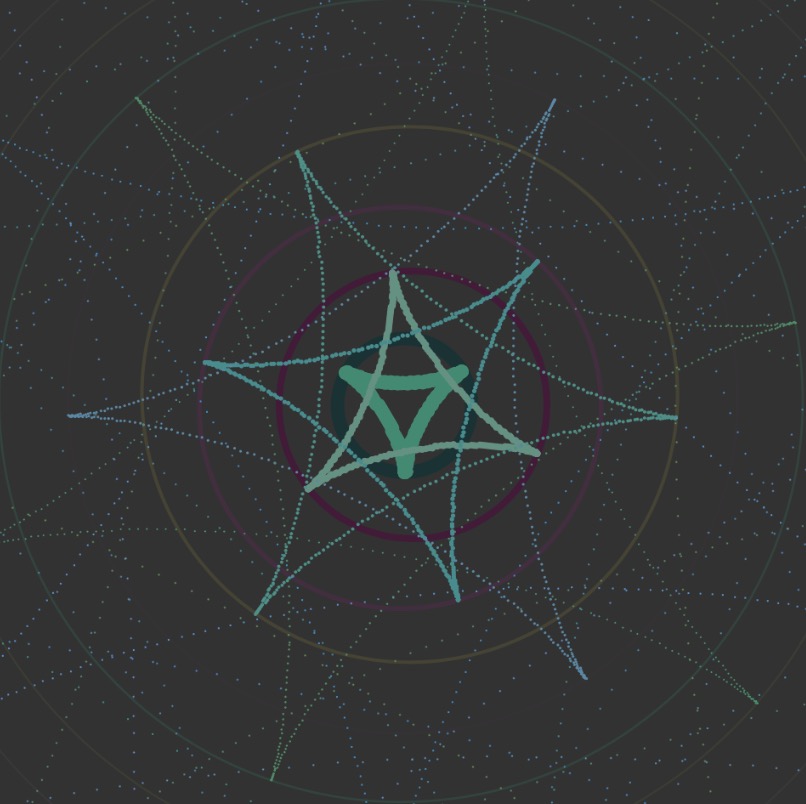
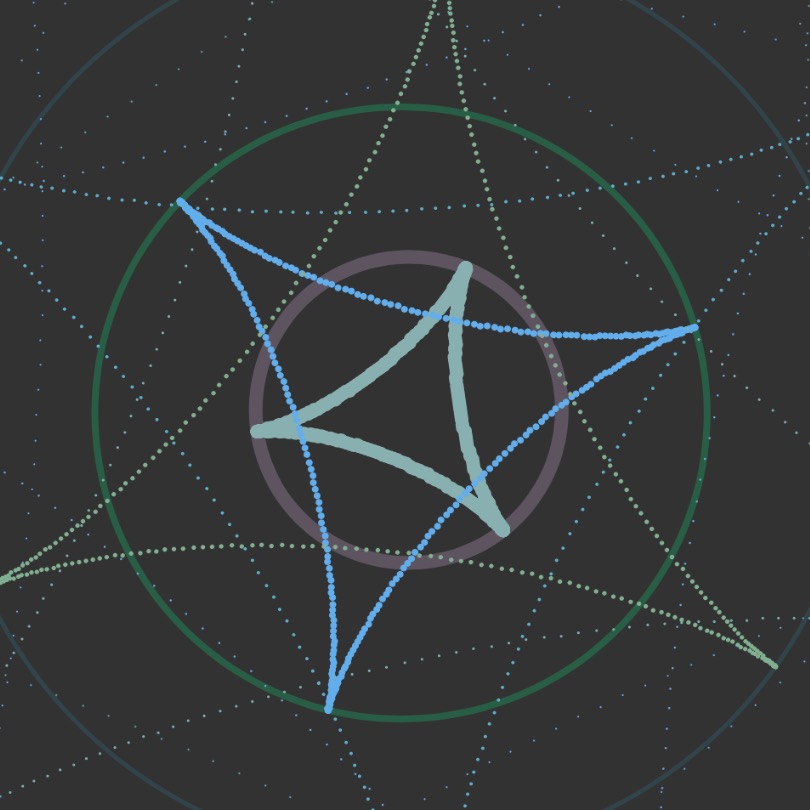
First, I went through the curves and picked out Deltoid (http://mathworld.wolfram.com/Deltoid.html) one to play around.
After I successfully drew our the curve in a static way, I thought about how to make it look more interesting. I tried to draw multiple curves in different scales but found that if they are in the same direction, it looked boring. So I tried to make them rotate and point to different directions. Next step, I used mouseX to control the rotation. And I thought if the scale of the curves can also be changed, it would be interesting! After this was done, I figured out I could also play around with the stroke weight to make curves look different and also colours!
I am glad that I finally got an interesting interactive result 🙂