// attributes of shape
var points;
var angle;

function setup() {
  createCanvas(480, 480);
  angleMode(DEGREES);
  frameRate(30);
}

function draw() {
  background(200);
  // set attributes to change with mouse position
  points = map(mouseX, 0, width, 0, 300);
  angle = map((mouseX + mouseY / 2), 0, width, 0, 360);
  // draw "main" curve
  stroke(209, 122, 110);
  drawCurve(width/2, height/2);

  // draw "background" curves, setting each to a random color
  // and a randomized position
  stroke(random(200, 255), random(200, 255), random(200, 255));
  drawCurve(width/2 + random(-10, 10), height/2 + random(-10, 10));
  stroke(random(200, 255), random(200, 255), random(200, 255));
  drawCurve(width/2 + random(-20, 20), height/2 + random(-20, 20));
  stroke(random(200, 255), random(200, 255), random(200, 255));
  drawCurve(width/2 + random(-30, 30), height/2 + random(-30, 30));
  stroke(random(200, 255), random(200, 255), random(200, 255));
  drawCurve(width/2 + random(-40, 40), height/2 + random(-40, 40));
}

function drawCurve(posX, posY) {
  var x;
  var y;
  //var a = 400;
  var b = map(mouseY, 0, 480, 20, 80);

  strokeWeight(1);
  noFill();

  push();
  translate(posX, posY);
  rotate(angle);
  // astroid curve (http://mathworld.wolfram.com/Astroid.html)t
  beginShape();
  for (var i = 0; i < points; i++) {
    x = 3 * b * cos(i) + b * cos(3* i);
    y = 3 * b * sin(i) - b * sin(3 * i);
    vertex(x + random(0,2), y + random(0,2));
  }
  endShape(CLOSE);
  pop();
}
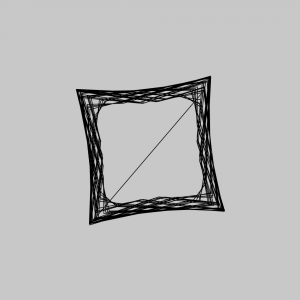
Since I was a little overwhelmed with the idea of creating a project based on mathematical curves, I decided to approach the project by “sketching” in the browser and figuring out how the code/ curve would render as I modified different variables. I chose an astroid for my curve. I also hadn’t originally set the angle mode of the drawing to degrees, and ended up with a spirograph-like drawing at first which was visually interesting, but not quite what I was going for.
Once I had figured out how to make the curve actually a curve, I added in variables to make the size, number of points drawn, and rotation of the curve interactive. I also added elements of randomization to try to achieve a flickering/ glitching effect to add more interest.
![[OLD FALL 2017] 15-104 • Introduction to Computing for Creative Practice](https://courses.ideate.cmu.edu/15-104/f2017/wp-content/uploads/2020/08/stop-banner.png)