![[OLD FALL 2017] 15-104 • Introduction to Computing for Creative Practice](https://courses.ideate.cmu.edu/15-104/f2017/wp-content/uploads/2020/08/stop-banner.png)
Swedish Morality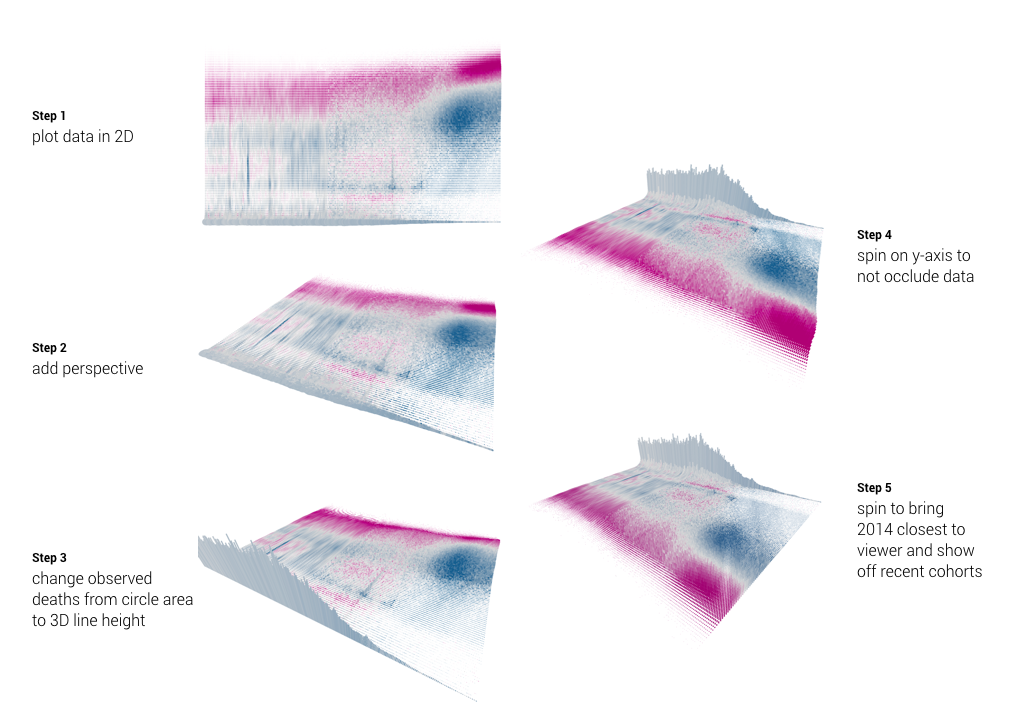
Swedish Morality
The is a project done by Skye Moret in 2017 to visualize 264 years of Swedish mortality. This is a unconventional yet visually pleasing and intuitionistic diagram. I particularity appreciate two aspects of it: it uses not only the conventional x, y axis, but also incorporate z-axis to make the chart 3D. Also, the visualization is not only a still image, but a motion that rotates the perspective, and shows the timeline step by step. With computers we can explore many ways to demonstrate and convey data. Moret’s choice of color, gradient, and the shadow effect, all demonstrate her artistic sensibility.
The software Moret used is Processing—a free and “flexible software sketchbook and language for learning how to code within the context of visual arts.” It has amazing mapping data to visual attributes that allow users to change aspects such as opacity, color, and perspective.
You can read more here