![[OLD FALL 2017] 15-104 • Introduction to Computing for Creative Practice](https://courses.ideate.cmu.edu/15-104/f2017/wp-content/uploads/2020/08/stop-banner.png)
function setup() {
createCanvas(400, 400);
frameRate(10);
}
function draw() {
background(245, 252, 99);
// draw the frame
fill(0);
noStroke();
stroke(1);
// draw the curve
push();
translate(width / 2, height / 2);
drawNeoid();
pop();
}
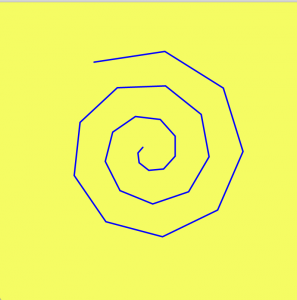
function drawNeoid(){
var x;
var y;
var ac = mouseX/50;
var a = constrain(ac, 0.4, 80);//constrains variable to keep curve from scrunching too small
var b = mouseY/100;
noFill();
stroke(0,0,255);
strokeWeight(2);
beginShape();
for(var i = 0; i < width; i+=5){
var t = map(i, 0, -10, 10, TWO_PI);//maps theta so curve expands and contracts smoothly
x = cos(t) * (a * t + b);//parametric equation for neoid
y = sin(t) * (a * t + b);//parametric equation for neoid
vertex(x,y);
}
endShape(OPEN);
}
I started by playing with the epichondroid curve example code. By using the vertex command twice with differently ordered variables, I was able to render the curves in interesting ways. I then moved to playing around with a neoid curve, and by adjusting the for loop I was able to achieve the curve I ended up with.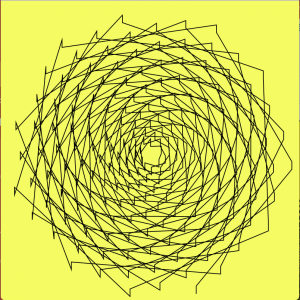
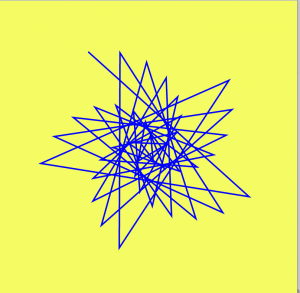
These are examples of what the curve would have looked like if my for loop had added 5, 10, and 15 to i.