![[OLD FALL 2017] 15-104 • Introduction to Computing for Creative Practice](https://courses.ideate.cmu.edu/15-104/f2017/wp-content/uploads/2020/08/stop-banner.png)
Inequaligram, a project worked on by Lev Manovich and Agustin Indaco, is a project that focused on analyzing public Instagram images in Manhattan over a period of five months. The point of the project was to measure and correlate the economic equality with how much people share between different parts of the city.
I really look up to this project since it tackles a new modern day social issue relating to inequality that many people are affected by in one way or another. The result was interesting in that after analyzing over 7 million photos, they found that the inequality of these images were actually higher than inequalities between different standards of living of the locals; and that the inequality of visitors’ images is even larger than extreme income inequality. Poor areas show much less while rich areas have become “social media rich”.
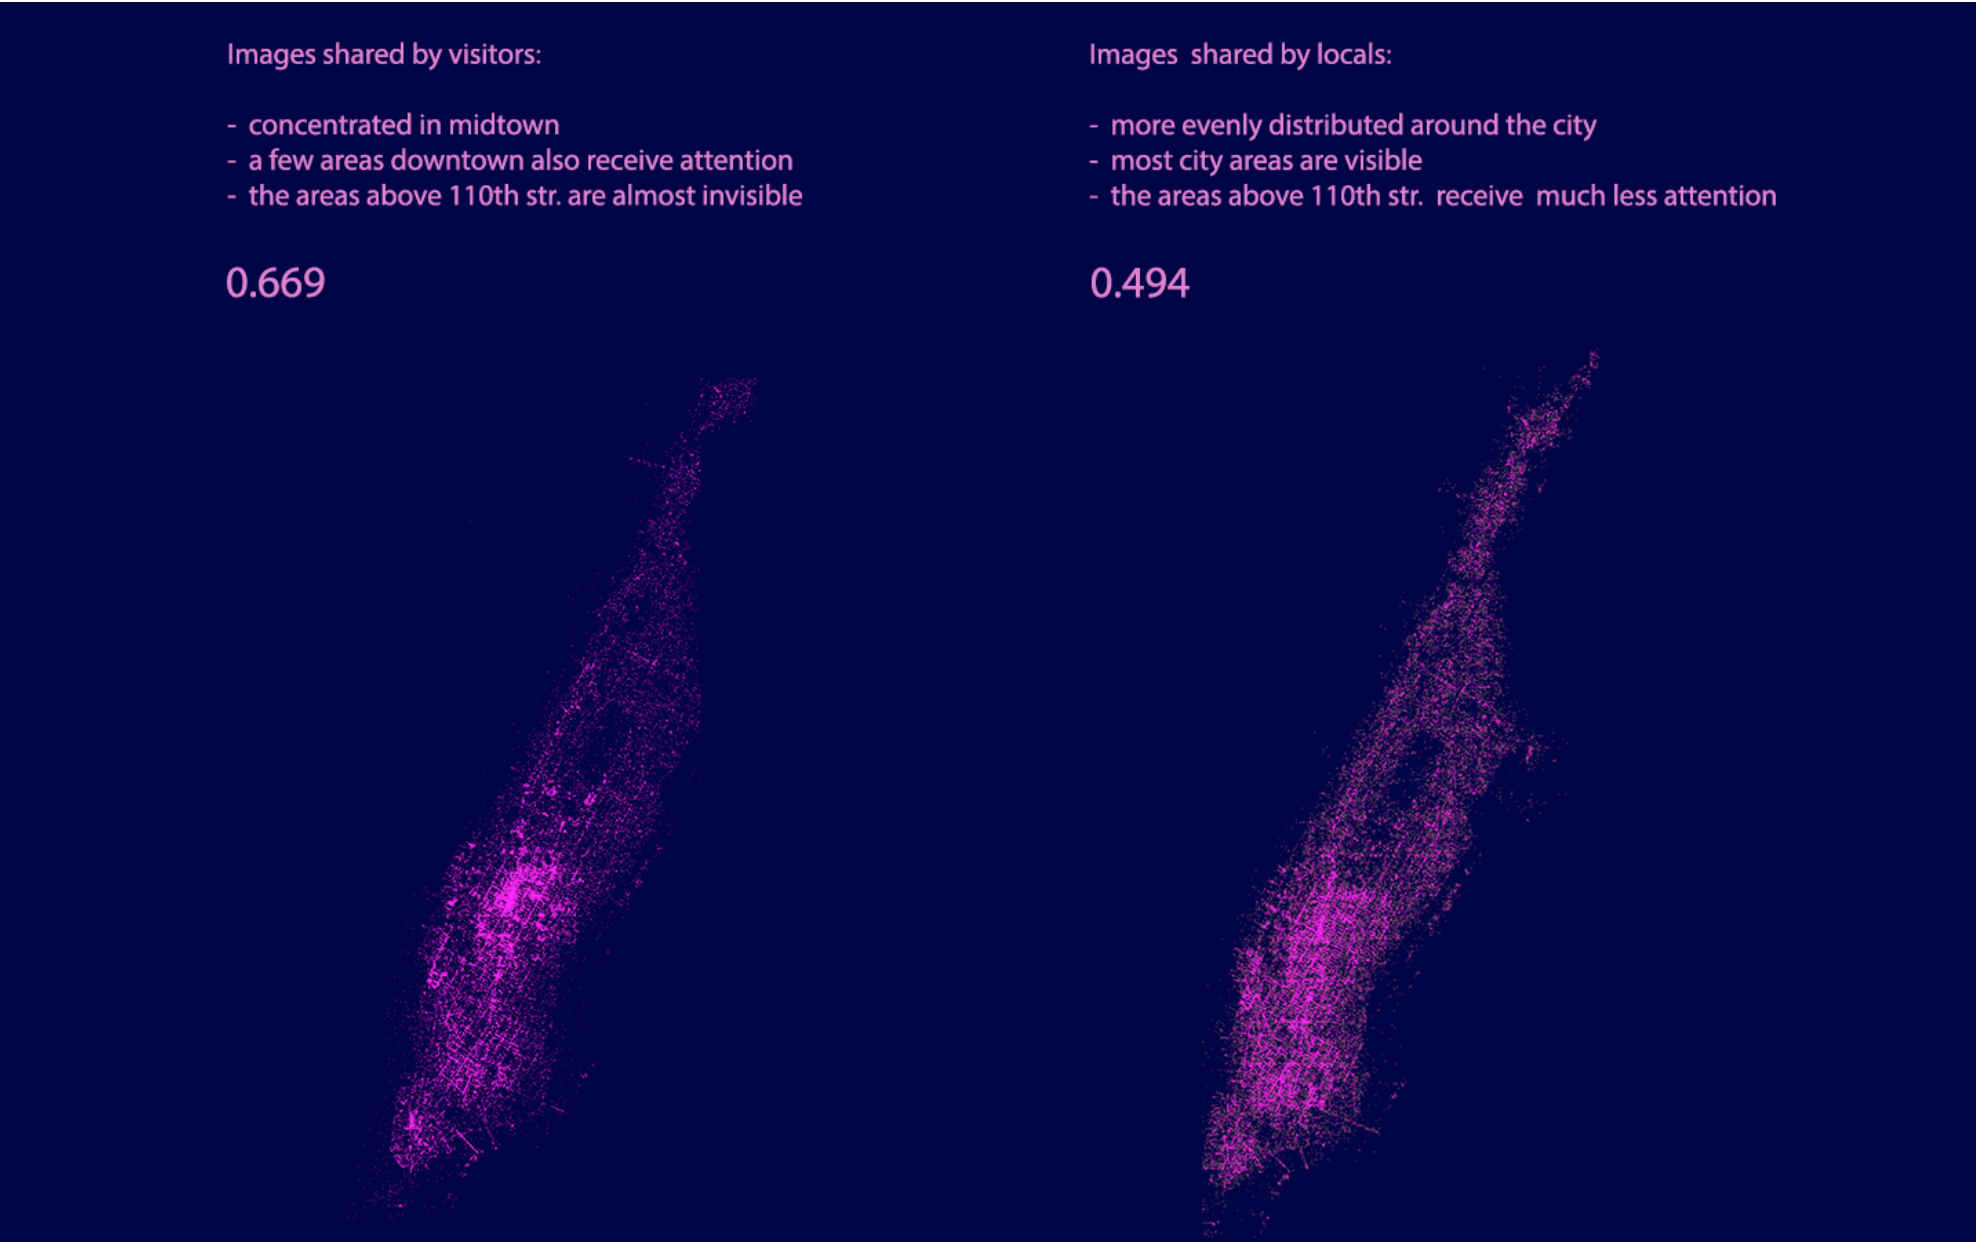
In order to generate the dataset for this research, Lev Manovich and Agustin Indaco used Instagram images with location information to collect their data while using the standard measure of inequality (Gini index) to measure the social inequality. In order to visualize all this data, they plotted locations of 200,000 random images from their dataset.