![[OLD FALL 2017] 15-104 • Introduction to Computing for Creative Practice](https://courses.ideate.cmu.edu/15-104/f2017/wp-content/uploads/2020/08/stop-banner.png)
//Heidi Chung
//Section A
//hschung@andrew.cmu.edu
//Project-07
var nPoints = 1000;
function setup() {
createCanvas(400, 400);
frameRate(10);
}
function draw() {
background(70, 140, 140);
var a = 1.5;
var b = 1.0;
var w = map(height/2, height/2, width/4, width-(width/4));
var inc = TWO_PI/(mouseX-height/4);
for (var waves = 0; waves < 400; waves++) { //waves behind the butterfly
strokeWeight(20);
stroke(83, 167, 218, 90);//blue thin lines sine curve
line(w, 100 -mouseY, waves*4 -mouseY, 100+sin(b)*40.0);
b = b + inc;
strokeWeight(3);
stroke(126, 180, 227, 90);//blue thick dotted sine curve
line(waves*10, 50, waves*4, 50+sin(b)*40.0);
b = b + inc;
strokeWeight(5);
stroke(30, 160, 154, 90); //green dotted sine curve
line(w, 150 -mouseY, waves*4, 150+sin(b)*40.0);
b = b + inc;
stroke(30, 160, 154, 90); //green lines sine curve
line(waves*10, 250, waves*4, 250+sin(b)*40.0);
b = b + inc;
stroke(255, 122, 153, 90); //dark pink dotted sine curve
line(w, 300, waves*4 -mouseX, 300+sin(b)*40.0);
b = b + inc;
}
push();
translate(width/2, height/2+30); //centers the butterfly
drawButterfly();
pop();
}
function drawButterfly() {
var x;
var y;
stroke(30, 160, 154, 90);
fill(255, 200, 200);
beginShape();
for (var i = 0; i < nPoints; i++) {
var t = map(i, 0, nPoints, 0, TWO_PI); //adding mouseX and mouseY alters the power of sin()
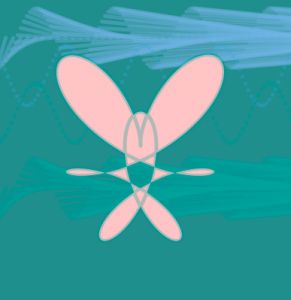
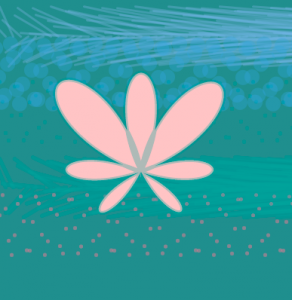
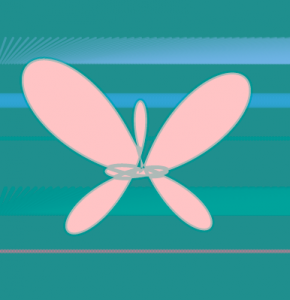
x = -50 * (sin(t) * (exp(cos(t))- 2*cos(4*t) + pow(sin((1*t+mouseX)/12), 5)));
y = -50 * (cos(t) * (exp(cos(t))- 2*cos(4*t) + pow(sin((1*t+mouseY)/12), 5)));
vertex(x, y);
//I chose the Butterfly Curve.
//http://mathworld.wolfram.com/ButterflyCurve.html
//adding the negative sign into the equation flips the butterfly vertically
}
endShape(CLOSE);
}So at first, when I browsed the curves on the Mathworld website, I was drawn to the Butterfly Curve, and thought it would look interesting if it grew large and small from its center. So I looked at it but was warded off because it looked complicated and I wasn’t sure how to denote it in p5.js. Then I started playing with sine curves. I later realized with the help of my friend that the sine curve wasn’t an equation choice from the given site, so I (begrudgingly) went back to the Butterfly Curve and to my surprise, was able to translate it over into code without too much of a hitch… I was a little confused about how to write the parametric equations for the Butterfly Curve but the p5.js reference page helped a lot. I also added the sine curves I had been playing with into the background. I actually quite like the ever “fluttering butterfly” I was able to make. It makes some interesting heart/hybrid shapes too.