![[OLD FALL 2017] 15-104 • Introduction to Computing for Creative Practice](https://courses.ideate.cmu.edu/15-104/f2017/wp-content/uploads/2020/08/stop-banner.png)
//Max Stropkay
//Section E
//mstropka@andrew.cmu.edu
//Project_07

var nPoints = 1000;
function setup() {
  createCanvas(480, 480);


}
function drawEpicycloid(){
  // x = (R+r)cos theta - r cos((R+r)/r)theta)
  // y = (R + r)sin theta - rsin(((R+r)/r)theta)

  var R = 100 //radius of large circle
  var r = 10 //radius of small circle
  var a = mouseX //take values of mouse x
  var b = mouseY //take values of mouse y

  //draw curve in center of screen
  push();
  translate(240, 240)
  noFill();
  strokeWeight(.01);

  //draw curve
  beginShape();
  for(var i = 0; i < nPoints; i++){

    var t = map(i, 0, nPoints, 0, TWO_PI);

    var x = (a + r)*cos(t) - (r)*cos(((a + b)/r)*(t))
    var y = (b + r)*sin(t) - (r)*sin(((a + b)/r)*(t))

    //points of curve will be drawn at somewhere within 50 pixels of (x,y)
    vertex(x + random(-50, 50),y + random(50, - 50));
  }
  endShape(CLOSE);
  pop();
}

function draw(){
  drawEpicycloid();
}
//redraw background if the mouse is pressed
function mousePressed(){
  background(255);
}
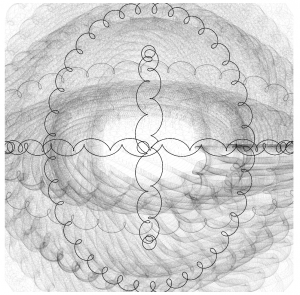
For this assignment, I used the equation for an epicycloid with the mouse’s location driving certain variables to change the shape as the mouse moves. I can’t say I understand the equation for this type of curve that well so I just started substituting the mouseX and mouse Y value for random variables in the equation until I got something that looked cool. I also added a random value to the x and y coordinates of the points that the program draws.
Here is a screenshot from before I added the random values to the x and y coordinates.