![[OLD FALL 2017] 15-104 • Introduction to Computing for Creative Practice](https://courses.ideate.cmu.edu/15-104/f2017/wp-content/uploads/2020/08/stop-banner.png)
Creator: Stamen Design
Title of Work: WHO Immunization Report 2016
Year of Creation: 2016
Link to Project Work: https://stamen.com/work/who-immunization-2016/
Link to Artist Bio: https://stamen.com/about/
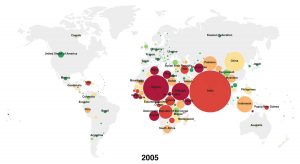
The WHO Immunization Report visualization created by Stamen Design was created in an effort to improve visualization and public understanding of report data — by combining understandable text with analogous information, the report is inviting and easier to read. As a communications designer, this bridge is especially important — if information is not obviously readable, then the general public would not browse through the data in order to understand it.
The algorithms relevant to how the information was visualized was not explicitly stated by Stamen, however it can be implied that the proportions and colours of some elements (i.e. circle size) are directly affected by the size of the data (i.e. number of unvaccinated children in a country). As a company, Stamen Design creates data visualizations and maps — these algorithms are most likely duplicated and applied to each of their works.