![[OLD FALL 2017] 15-104 • Introduction to Computing for Creative Practice](https://courses.ideate.cmu.edu/15-104/f2017/wp-content/uploads/2020/08/stop-banner.png)
//Robert Managad
//Section E
//rmanagad@andrew.cmu.edu
//Project-07

var nPoints = 850

function setup() {
    createCanvas(400, 400);
  	frameRate(25);
}

function draw() {

	//color set-up
	var r = map(mouseX, 0, width, 160, 200);
	var g = map(mouseY, 0, height, 20, 60);
	var b = map(mouseY, 0, height, 20, 60);
	noFill();
	//modification of background and strokecolours
	background(2, g, b);
	stroke(r, g, 47);
	strokeWeight(0.5);
	translate(width/2, height/2);
	Hypotrochoid();
}

function Hypotrochoid (){
	// equations for recollection
	// x= (a-b)cost + hcos(((a-b)/b) * theta)
	// y= (a-b)sint + hsin(((a-b)/b) * theta)
	var x;
    var y;
    var h = 200;
    //variables to modify displacement from center.
    var a = map(mouseX, 0, width, 0, 10);
    var b = map(mouseY, 0, height, 0, 15);
    var c = map(mouseX, 0, width, 0, 5);
    var d = map(mouseX, 0, width, 0, 50);
    beginShape();
      for(var i = 0; i < 500; i ++) {
        var theta = map(i, 0, width/2, 0, 360);
        x = (a - b) * cos(theta) + h * cos(((a - b)/b) * theta);
        y = (a - b) * sin(theta) - h * sin(((a - b)/b) * theta);
        vertex(x , y);
      }
    endShape();
    beginShape();
      for(var i = 0; i < nPoints; i ++) {
        var theta = map(i, 0, width, 0, 360);
        x = (c - d) * cos(theta) + h * cos(((c - d)/d) * theta);
        y = (c - d) * sin(theta) - h * sin(((c - d)/d) * theta);
        vertex(x + noise(2) * width/3, y + noise(2) * width/3);
      }
    endShape();
}
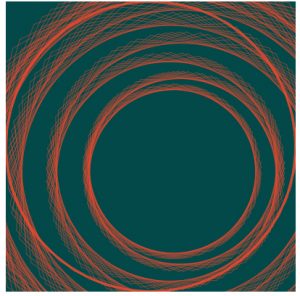
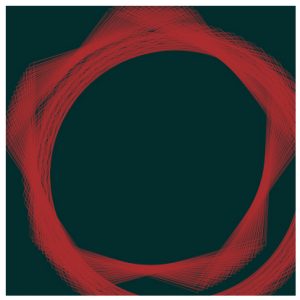
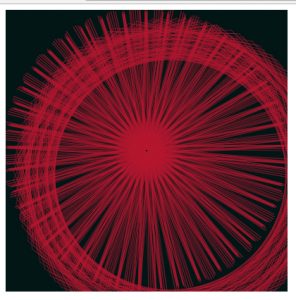
My primary goal for this project was familiarizing myself with curve equations, and their applications to existing shape structures. My first attempt with a conchoid was unsuccessful — I was not able to produce a visible result — so I moved on to hypotrochoids and applied similar plans to it. Below are curve sketches I examined to contribute to my final program: