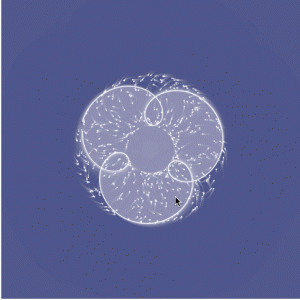
My math is a bit rusty so my head spun when perusing the Mathworld website. I first played around with the equations given in the project example, which resulted in this:

I studied each part of the code until I was able to create another curve. I created a Cartioid Curve that increases size and rotates based on mouseX, and the background also changes based on the mouseX and mouseY positions.
// Tiffany Lai
// 15-104, Section A
// thlai@andrew.cmu.edu
// Project 07 - Curves

var nPoints = 500; // amount of points in curve

function setup() {
    createCanvas(480, 480);
}

function draw() {
    // background changes colors based on mouse position
    var r = map(mouseX, 0, width, 50, 200);
    var g = map(mouseY, 0, width, 150, 200);
    var b = map(mouseX, 0, height, 200, 255);
    background(r - 100, g - 100, b - 100, 130);

    drawCurve(); // draw the cardioid curve
}

function drawCurve(){
    //mathworld.wolfram.com/Cardioid.html

    var x; // defining x and y positions of vertices in curve
    var y;

    var a = map(mouseX, 0, width, 0, 100); // map mouseX from 0 to 5

    fill(100, 200, 255, 20); // blue
    stroke(255); // white
    translate(width/2, height/2);

    beginShape();
    for (var i = 0; i < nPoints; i++) {
        var t = map(i, 0, nPoints, 0, TWO_PI);
        x = a * (1 + cos(t)) * cos(t); // parametric equation of cardioid
        y = a * (1 + cos(t)) * sin(t); // parametric equation of cardioid

        rotate(radians(mouseX/500)); // rotate based on mouseX
        ellipse(x, y, 1, 1); // draw spiral of dots
        vertex(x, y); // draw the first curve (blue)
    }
    endShape();

    beginShape();
    for (var i = 0; i < nPoints; i++) {
        var t = map(i, 0, nPoints, 0, TWO_PI);
        x2 = a * (1 + cos(t)) * cos(t); // parametric equation of cardioid
        y2 = a * (1 + cos(t)) * sin(t); // parametric equation of cardioid

        rotate(radians(mouseX/500)); // rotate based on mouseX
        fill(255, 150, 150, 20); // pink
        vertex(x2, y2); // draw the second curve (pink)
    }
    endShape();
}
![[OLD FALL 2017] 15-104 • Introduction to Computing for Creative Practice](https://courses.ideate.cmu.edu/15-104/f2017/wp-content/uploads/2020/08/stop-banner.png)