![[OLD FALL 2017] 15-104 • Introduction to Computing for Creative Practice](https://courses.ideate.cmu.edu/15-104/f2017/wp-content/uploads/2020/08/stop-banner.png)
Running Drawings
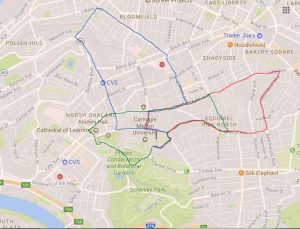
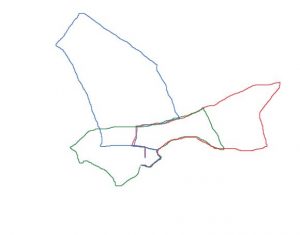
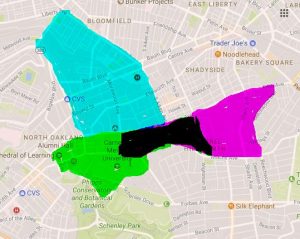
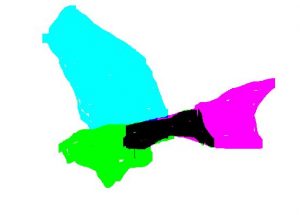
For my final project, I would like to create some data visualizations of the running routes I do in Pittsburgh. These visualizations would be algorithmic drawings documented as a running diary of my daily or weekly runs. What I normally do not notice on a run are the larger gestures I make and the shapes, speed rates, and heart rate variations accompanying the larger gesture of a route. Mapping out these routes, and creating algorithmic drawings from the resulting shapes would not only visualize the “gestures” I am constantly making but unaware of, but also document trends on the routes which can affect my running and the way we look at a route retrospectively. I would be using turtle functions to follow the path, and arrays and for loops to create algorithmic patterns/visuals for a more appealing visualization of how I felt that day.