juyeonk-Project-07-Curves-Section E

sketch

//Claire Koh
//Section E
//juyeonk@andrew.cmu.edu
//Project-07


function setup() {
    createCanvas(480, 480); //sets the size of the canvas 
}


function draw() {
    background(0);
    translate(width/2, height/2); //so that the shapes would begin from the center of the canvas
    drawStar();
    drawRose();
}


//this function will generate the outer shape. There is no specific name for this curve. I invented this 🙂 Also it's called drawStar because it'll draw a star if you move your mouse towards the furthermost right side of the canvas. 
function drawStar() {
    var flicker = random(240, 255); //will be used to make the star flicker 
    var transparency = random(100,200); //also will be used to make the star flicker by controlling its transparency
    var gradient = map(mouseX, 0, width, 0, 255)
    var a = constrain(mouseX, 50,480);
    var n = constrain(mouseX, 50,480);
    
    if (a != 480) {
        push();
        rotate(mouseY/300);
        fill(0);
        strokeWeight(0.7);
        stroke(200,255-gradient,255-gradient);
        beginShape();
            for (var t=0; t <= 2 * PI; t+= PI/100) {
                var x = 0.5 * a * cos(n * t); 
                var y = 0.5 * a * sin(n * t); 
                vertex(x, y);
            }  
        endShape();
    }
    
    
    //when the a value of the equation reaches 480, the curve's stroke color and fill color will change
    else {
        push();
        rotate(mouseY/300);
        fill(flicker, 200, 200, transparency);
        strokeWeight(2);
        stroke(255);
        beginShape();
            for (var t=0; t <= 2 * PI; t+= PI/100) {
                var x = 0.5 * a * cos(n * t); 
                var y = 0.5 * a * sin(n * t); 
                vertex(x, y);
            }  
        endShape();
        pop();
    }
}


//this function will draw the fixed rose in the middle of the canvas
function drawRose() {
    //http://mathworld.wolfram.com/Rose.html
    var a = map(mouseX, 0, width, 0, 40);
    var n = map(constrain(mouseX, 0, width), 0, width, 0 , 6);
    var r;
    
    noFill();
    strokeWeight(1);
    stroke(255);
    
    push();
    rotate(mouseY/300)
    beginShape(); // will draw the rose shape in the middle 
        for (var t=0; t <= 2 * PI; t+= PI/100) {
            r = a*sin(n*t);
            x = r * cos(t);
            y = r * sin(t)
            vertex(x,y);
        }
    endShape();
    pop();
    
}


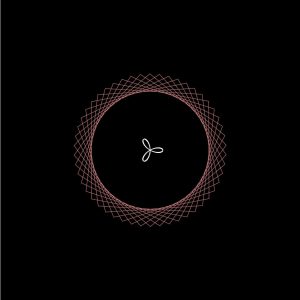
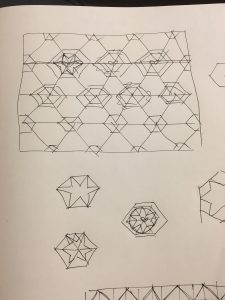
For this project I wanted to create a set of symmetrical curves that are somewhat related to each other for the sake of aesthetics and clarity.

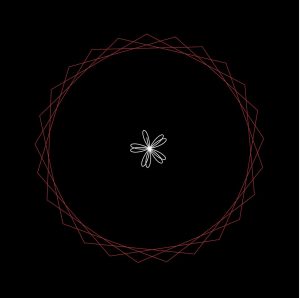
The shapes starts with a square and a point in the very middle. But as you move your mouse sideways you’ll notice the outer curve changes to a drastic degree while all the inner curve is doing is just drawing more rose petals at a time. The outer shape doesn’t have a specific name; it was a result of an incorrect rose petal function but I am satisfied at how it turned out because of the variety of shapes it could create.
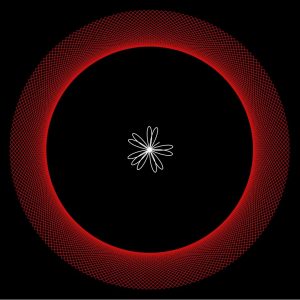
I added a bit of fun by making the star flicker at the end when the outer shape is complete.
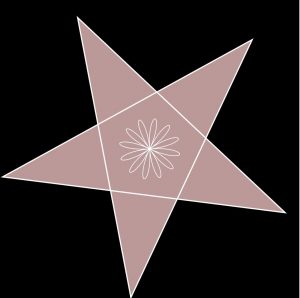
(Final form)


juyeonk-Looking Outwards-07

Video: showing the paths of airplanes over North America in different colors.


Title: Flight Patterns

Artist: Aaron Koblin

Year of Creation:

Link to the Project: http://www.aaronkoblin.com/project/flight-patterns/

Link to the Bio of the Artist: http://www.aaronkoblin.com/project/about/


This project was intended to visualize the air traffic above North America over the course of a day. Originally, this work was made as a part of the experiments for the larger project called “Celestial Mechanics” by Aaron Koblin and their colleagues named Scott Hessels and Gabriel Dunne at UCLA. They attained the flight information from the Federal Aviation Administration, analyzed the data and plotted them using the Processing programming environment. Colors and special effects were added later using Adobe After Effects and Maya.

(Before the special effects were added)


Flight Patterns

(After the effects were added)


juyeonk-AbstractClock-06

sketch

var prevSec;
var millisRolloverTime;

var startingPoint = -90; //lets the bar-graph clocks start from the 0 o'clock position
var transparency1 = 255; //determines the transparency of the second bar graph
var transparency2 = 255; //determines the transparency of the minute bar graph
var transparency3 = 255; //determines the transparency of the hour bar graph


function setup() {
    createCanvas(220, 300);
    millisRolloverTime = 0;
}

function draw() {
    angleMode(DEGREES);
    
    var heur = hour();
    var minutee = minute();
    var seconde = second();
    var milliseconde = millis();
    
   
    background(0);
    
    
    if (prevSec != seconde) {
        millisRolloverTime = millis();
    }
    prevSec = seconde;
    var mils = floor(millis() - millisRolloverTime);


    var secondsWithFraction   = (mils / 1000.0);
    
    //remaps the millisecond accordingly to the width of the path of the bar graphs
    var secondBarWidthSmooth  = map(secondsWithFraction, 0, 1, 0, width-100);
    
    
    //position of the bar graphs; the +50 is so that the left side of the bar graphs would be touching the left wall at second=0
    var position = secondBarWidthSmooth+ 50;


    //to produce an oscillating motion of the bar graphs: if the second is an odd number than the 
    if (seconde % 2 == 1) {
        position = width-50-secondBarWidthSmooth;
    }
    else {
        position = position;
    }


    //outline of the clock
    stroke(255)
    noFill();
    ellipse(position, height/2, 100, 100)
    
    
    //hour
    noStroke();
    fill(255-heur*3, 255-heur*2, 255, transparency3);
    arc(position, height/2, 100, 100, startingPoint, startingPoint+360/12*heur);
    
    
    //minute
    noStroke();
    fill(200,100+minutee*2,80+minutee,transparency2);
    arc(position, height/2, 75, 75, startingPoint, startingPoint+360/60*minutee);
    
    
    //second
    noStroke();
    fill(180,10,10, transparency1);
    arc(position, height/2, 50, 50, startingPoint, startingPoint+360/60*seconde);


    //corresponding bar graph will disappear if the second/minute/hour hand hits zero and then reappear when it hits 1
    if (seconde == 0 || seconde > 59) {
        transparency1 =0;
    }
    else {
        transparency1 = 255;
    }
    
    
    if (minutee == 0) {
        transparency2 = 0;
    }
    else {
        transparency2 = 255;
    }
    
    
    if (heur == 0) {
        transparency3 = 0;
    }
    else {
        transparency3 = 255;
    }


}


For this project I created a clock made of three pie graphs, each representing the second, minute and the hour, that oscillates between the two walls every second. The graphs also change their colors over the course of minute/hour.

At first I didn’t know what/how the clock has to do/look like for it to be ‘abstract’, so I tried to create a clock that looks like Mondrian’s painting.

But then I realized maybe it’s something that tells the time without explicitly displaying what time it is. So I tried to incorporate color/position of the clock itself to imply a change in time.

Hardest part of this project was probably making the clock oscillate accordingly each second smoothly, instead of moving one pixel and then stopping and then moving and then stopping. At first I was thinking of manipulating the framecount, but I figured it’d be easier to play around with the code that was posted on the Deliverables page that created a bar that creeps up smoothly every second. First I had to change it so that the position of the circle is the one changing instead of the width of the rectangle, and then the clock would reset itself to the origin after each second.  And then I had to remap the value of the millisecond so that one second would take up the entire width of the canvas. Then I had to make sure that the clock would change its direction and creeps back towards the origin instead of transporting back to it.


juyeonk-LookingOutwards-06


(Example of a minuet created by using Mozart’s K.516f.


Title: K.516f

Creator: Wolfgang Amadeus Mozart

Year of Creation: 1787

Link to the Article:                              http://www.pianonoise.com/Article.dice.htm  https://en.wikipedia.org/wiki/Musikalisches_W%C3%BCrfelspiel

Link to the Bio of the Artist: https://www.biography.com/people/wolfgang-mozart-9417115


K.516f is a minuet composed by Mozart in 1787 according to his own version of Musikalische Würfelspiele. Musikalische Würfelspiele (translated: musical dice game) describes any type of game / means of composing musical pieces that involves rolling one or more dices to randomly generate the notes or measures, and it was popular among the composers in the 18th century Europe. It was supposed to offer a fun alternative way of composing, even for the amateurs who were not familiar with the basic rules of composition. Its exact origin or inventor is unknown, but the very first example dates back to 1757, when Johann Philipp Kirnberger wrote Der allezeit fertige Menuetten- und Polonaisencomponist (German for “The Ever-Ready Minuet and Polonaise Composer”). Other famous versions include the ones by C.P.E Bach (J.S. Bach’s fifth son).

The most well-known version of Musikalische Würfelspiele and its product were published by Mozart in 1787. Composition K.516f included the instruction of the game and the pres-made measures to choose from.

Here’s how Mozart’s version works:

There are 176 pre-written measure to choose from if one is to compose a Minuet; 96 if Trio. Two six-sided dices are then rolled to determine which measure comes next. Using the instruction sheet, one could determine which dice roll corresponds to which measure put next.

It’s impressive how the composition sounds so put together and well thought-out even though the measures are randomly arranged. Maybe it’s just Mozart’s brilliance that he was able to compose individual measures that would sound coherent no matter how they are arranged.


juyeonk-LookingOutwards-05

Image result for flume album art


Image result for flume album art


Image result for flume album art


Title: Album art for Flume’s ‘Skin’

Creator: Jonathan Zawada

Year of Creation: 2016

Link to the Project: https://creators.vice.com/en_au/article/jpbxy8/visionaries-jonathan-zawada-interview

Behind The Cover Art Of Flume’s Grammy Winning Album

Link to the Bio of the Artist: http://www.zawada.art/about/


Many people have come across these artworks at least once in the past few years, but never wondered how they were actually made. Behind the Grammy-winning album were the cover artworks created by a digital artist and a designer named Jonathan Zawada.

He has covered a variety of medium and and kinds of artworks such as music video, furniture design and album cover design. And as you can infer from these album arts, a lot of his work is inspired by nature. Nevertheless, he was never really interested in flowers, until he started working for Flume’s album designs. This set of designs include a variety of flowers or flower-inspired images with different colors and textures all generated by computer procedures. The specific algorithm he used generates different appearances of flower petals and “all the tiny little disturbances on the surfaces”. It is ironic how the mathematical programming he used was for the purpose of creating the “airy-feathery I-love-nature” effects. He acknowledges that there are other ways of approaching these natural objects or creating such effects such as hand-paintings or drawings, but he said that he does not necessarily feel like cheating using computer programs to generate these images.


juyeonk-project05-wallpaper

sketch

var x = 0;
var y = 0;
var THeight = 54.6;
var TBase = 63;


function setup() {
    createCanvas(441, 328.5);
    background (253, 226, 222);


//small white triangles in the furthermost back: odd-number rows
for (var x = 0; x <= width; x += TBase) {
        for (var y = 0; y < height; y += 2 * THeight) {
            noFill();
            stroke (255, 180);
            strokeWeight (2);
            triangle (x, y + THeight, x + TBase/2, y, x + TBase, y + THeight);
        }
}

//small white triangles in the furthermost back: even-number rows
for (var x = 0; x <= width; x += TBase) {
        for (var y = -THeight; y < height; y += 2 * THeight) {
            noFill();
            stroke (255, 180);
            strokeWeight (2);
            triangle (x - TBase/2, y + THeight, x, y, x + TBase/2, y + THeight);
        }

}
    
//orange hexagons: first and third rows
for (var x = -TBase/2*3; x <= width; x += 2 * TBase) {
        for (var y = -THeight; y < height; y += 4 * THeight) {
            fill(247, 148, 29,60);
            beginShape();
            vertex(x + TBase/2, y);
            vertex(x, y + THeight);
            vertex(x + TBase/2, y + 2 * THeight);
            vertex(x + TBase / 2 * 3, y + 2 * THeight);
            vertex(x + 2 * TBase, y + THeight);
            vertex(x + TBase / 2 * 3, y);
            endShape(CLOSE);
        }
}

//small white hexagons: even-number rows
for (var x = -TBase/3; x <= width; x += TBase) {
        for (var y = 0; y < height; y += 2 * THeight) {
            fill(255, 180);
            noStroke();
            beginShape();
            vertex(x, y  + THeight);
            vertex(x + TBase/6, y + THeight/3*4);
            vertex(x + TBase/2, y + THeight / 3 * 4);
            vertex(x + TBase / 3 * 2, y + THeight);
            vertex(x + TBase/2, y + THeight/3*2);
            vertex(x + TBase/6, y + THeight / 3 * 2);
            endShape(CLOSE);
        }
}
 
//small white hexagons: odd-number rows
for (var x = -TBase/6*5; x <= width; x += TBase) {
        for (var y = -THeight; y < height; y += 2 * THeight) {
            fill(255, 180);
            noStroke();
            beginShape();
            vertex(x, y  + THeight);
            vertex(x + TBase/6, y + THeight/3*4);
            vertex(x + TBase/2, y + THeight / 3 * 4);
            vertex(x + TBase / 3 * 2, y + THeight);
            vertex(x + TBase/2, y + THeight/3*2);
            vertex(x + TBase/6, y + THeight / 3 * 2);
            endShape(CLOSE);
        }
}

//orange hexagons: second and fourth rows
for (var x = -TBase/2; x <= width; x += 2 * TBase) {
        for (var y = THeight; y < height; y += 4 * THeight) {
            fill(247, 148, 29, 50);
            beginShape();
            vertex(x + TBase/2, y);
            vertex(x, y + THeight);
            vertex(x + TBase/2, y + 2 * THeight);
            vertex(x + TBase / 2 * 3, y + 2 * THeight);
            vertex(x + 2 * TBase, y + THeight);
            vertex(x + TBase / 2 * 3, y);
            endShape(CLOSE);
        }
}

    
//red triangles: first and third rows
for (var x = -2 * TBase; x <= width; x += 2 * TBase) {
        for (var y = 0; y < height; y += 4 * THeight) {
            fill(237,28,36,40);
            stroke(237, 28, 36, 90);
            triangle (x + TBase/2, y + 2 * THeight, x + TBase/2*3, y, x + TBase/2*5,y + 2 * THeight);
        }
}

    
//red triangles: second row
for (var x = -TBase; x <= width; x += 2 * TBase) {
        for (var y = 2 * THeight; y < height; y += 4 * THeight) {
            fill(237,28,36,40);
            stroke(237, 28, 36, 90);
            triangle (x + TBase/2, y + 2 * THeight, x + TBase/2*3, y, x + TBase/2*5,y + 2 * THeight);
        }
}

    
}


Since I wasn’t allowed to make a dynamic art for this project I decided to spice things up by increasing the complexity of the visual elements, or at least by attempting to do so.

First I drew out a pattern that uses hexagons and triangles as its primary visual elements and then transferred it into a code. While doing so, the nest for loops that I learned during the second part of the assignment came very useful.

One thing that I wish I could do was making a mirrored or a rotated array. In that way I could have created cool kaleidoscopic patterns, instead of having the same exact patterns laid out  side by side.

juyeonk-project04-stringart

sketch

var black = 0;

//dimension of the very first square
var a = 400/1.618;

//dimension of the margin on the top and bottom
var b = 150 - 200/1.618;

//dimensions of each squares
var dim1 = 400/1.618;
var dim2 = 400 - a;
var dim3 = 2 * a - 400;
var dim4 = 800 - 3 * a;
var dim5 = 5 * a - 1200;
var dim6 = 2000 - 8 * a;
var dim7 = 13 * a - 3200;

//color of each string
var color = 255;

function setup() {
    createCanvas(400, 300);
}

function draw() {
    var color = 255;
    background(black); //sets up the background color
    
    
    //strings sprouting out from the corner of the biggest square
    for (var i = 0; i <= a; i += a/20) {
        stroke(color);
        line(a, a + b, i, a + b - i);
    }
    
    //within the square there are always two corners facing each other that are sprouting the strings 
     for (var i = 0; i <= a; i += a/20) {
        stroke(color);
        line(0, b, i, a + b - i);
    }
    
    //strings sprouting out from the corner of the second biggest square
    for (var i = 0; i <= dim2; i += dim2 /20) {
        stroke(color);
        line(a, b + 400 - a, a + i, b + i);
    }
    
    //the opposite corner
    for (var i = 0; i <= dim2; i += dim2 /20) {
        stroke(color);
        line(400, b, a + i, b + i);
    }
    
    //strings sprouting out from the corner of the third biggest square
    for (var i = 0; i <= dim3; i += dim3/20) {
        stroke(color);
        line(width - 2 * a + 400, b + 400 - a, width - 2 * a + 400 + i, 300 - b - i)
    }
    
    //oppotiste corner
    for (var i = 0; i <= dim3; i += dim3/20) {
        stroke(color);
        line(400, height - b, width - 2 * a + 400 + i, 300 - b - i)
    }
    
    //strings sprouting out from the corner of the fourth biggest square
    for (var i = 0; i <= 800 - 3 * a; i += (800 - 3 * a)/20)
        {
        stroke(color);
        line(a + 800 - 3 * a, height - b - 800 + 3 * a, width - 2 * a + 400 - i, 300 - b - i)
        }
    
    //opposite corner
    for (var i = 0; i <= 800 - 3 * a; i += (800 - 3 * a)/20)
        {
        stroke(color);
        line(a, height - b, width - 2 * a + 400 - i, 300 - b - i)
        }
    
    //strings sprouting out from the corner of the fifth biggest square
    for (var i = 0; i <= 5 * a - 1200; i += (5 * a - 1200)/20)
        {
        stroke(color);
        line(a + 5 * a - 1200, 300 - b - 800 + 3 * a, a + i, b + 400 - a - i + 5 * a - 1200)
        }
    
    //opposite corner
        for (var i = 0; i <= dim5; i += dim5/20)
        {
        stroke(color);
        line(a, b + 400 - a, a + i, b + 400 - a - i + 5 * a - 1200)
        }
    
    //strings sprouting out from the corner of the sixth biggest square
    for (var i = 0; i <= dim6; i += dim6/20)
        {
        stroke(color);
        line(a + dim5 + dim6, b + dim2, a + dim5 + i, b + dim2 + i)
        }
    
    //opposite corner
        for (var i = 0; i <= dim6; i += dim6/20)
        {
        stroke(color);
        line(a + dim5, b + dim2 + dim6, a + dim5 + i, b + dim2 + i)
        }
    
    //strings sprouting out from the corner of the seventh biggest square
        for (var i = 0; i <= dim7; i += dim7/20)
        {
        stroke(color);
        line(width - dim3 - dim7, b + dim2 + dim6, width - dim3 - dim7 + i, b + dim2 + dim6 + dim7 - i)
        }
    
    //opposite corner
        for (var i = 0; i <= dim7; i += dim7/20)
        {
        stroke(color);
        line(width - dim3, b + dim2 + dim6 + dim7, width - dim3 - dim7 + i, b + dim2 + dim6 + dim7 - i)
        }
}


For this project I wanted to create a drawing based on golden ratio. It would have been nice if I could figure out a way to make the spiral-y shape made of sets of lines but I’m satisfied with what I have.

The most challenging part of this project was to figure out a logic that would make the strings loop around the pattern you want. Instead of making an array of lines I had to figure out a way to make the lines rotate around a fixed coordinate point. But other than, the project was farily do-able. I wish I planned something more challenging.sketch

juyeonk-LookingOutwards-04


Title: Ambient Synthesis

Creator: Amanda Ghassaei

Year: 2012

Link to the project: http://www.amandaghassaei.com/projects/ambient_synthesis/

Link to the bio of the artist: http://www.amandaghassaei.com/about/


Ambient Synthesis is a sound sculpture created by Amanda Ghassaei that senses the change in light stimuli in its surroundings and transforms them into sound. The program that is in charge of this transformation is called ‘Inkblot’, which uses the MaxMSP application to convert the light data into slowly evolving synthetic tones.

This sculpture was inspired by the concept of ‘additive synthesis,’ which outlines that simple sounds can be added or mixed together in order to create a broader and a more complex range of sounds.

This mechanism is best observed during sunrise and sunset where there is a drastic change in the amount of light present around the machine. When the sculpture is stimulated, one or more pixel will appear on its screen. Each pixel represents a different frequency of the harmonic series. When these pixels become activated, the tones that correspond to each pixel are added to the mixture, producing a gradually evolving soundscape over time.


juyeonk – project03 – dynamicdrawing

sketch

// Brandon Hyun
// 15-104 Section B
// bhyun1@andrew.cmu.edu
// Project 04

var increase = 15;
var xInt = 15;

var x1 = 0;
var y1 = 550;
var x2 = 550;
var y2 = 0;
var red;
var green;
var blue;

function setup() {
  createCanvas(400, 300);
}

function draw() {
  background (red,green,blue);
  var m = 400/25;
	for(var i = 0; i < m; i += 1) {
        strokeWeight(1);
		    stroke(40,40,40);


        for(var j =0; j<10; j+=1){
          line(mouseX+40*j, increase * i, increase * i +40*j, y1);
        }

		    for(var z =0; z<10; z+=1){
          line(mouseY+ x2 - increase * i, y2+40*z, x1, increase * i+ 40*z);
        }

	}
}

function mousePressed() {
  red = random(0,255);
  green = random (0,255);
  blue = random (0,255);
}

The most difficult part of this project was to code each strand of rain. It was more tedious than hard, but assigning random lengths and speed to each strand was definitely not easy.

You can move around the mouse to change the location of the umbrella.

I wish I could make the code take the mouseY into account as well so that the person wouldn’t smiling if the umbrella was below him/her.

juyeonk – Looking Outwards – 03


Title: Computational Design Of Metallophone Contact Sounds

Creator: Gaurav Bharaj, David I.W. Levin, James Tompkin, Yun Fei, Hanspeter Pfister, Wojciech Matusik, Changxi Zheng

Year of Creation: 2015

Link to the project: http://cfg.mit.edu/content/computational-design-metallophone-contact-sounds


This project is intended to explore the manufacturing process of metallophones of various shapes and sizes. Previously, professionally designed metallophones came only in the shapes of bars, and the collaborative team from Harvard, MIT and Columbia tried to come up with a way to produce metallophones of not only unique appearances but sounds as well. They invented an algorithm to deform and perforate metals of random shapes to optimize the sounds that they produced when struck. They believed the new method would enable non-professionals to make their own, unique metallophones as well.

Doing so requires an extensive exploration of the energy landscape. They first mapped the sound spectrum that the metal piece produced and compared it to the desired sound spectrum that they wanted the metal piece to produce. Then using the algorithm that allows the isotropic scaling of the metal piece in relation to the desired change in the sound spectrum and through the repeated process of discretization and instantiation, the team could produce a new piece of metal with an ideal sound spectrum. Using the same method, they could also have multiple tones and chords produced from a single metal piece.