jwchou-final project-E

For my project, I decided to stay with the theme I had developed throughout the semester with plane-based projects.

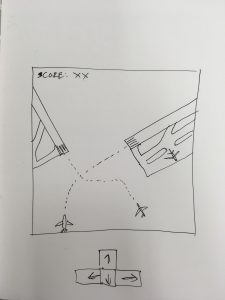
The objective of the game is to fly the plane onto the runway while avoiding mountains and lightning. Instructions for running the game are included.

I had a really hard time with this project. My original concept was perhaps more interesting but I had an extremely hard time executing it, so I pivoted my project to this secondary concept at the last minute. However, I had a lot of fun creating it, as well as working on the styling and themes of the splash screens in particular. I hope you enjoy it!

sketch 52

//Jackie Chou
//jwchou@andrew.cmu.edu
//Section E
//Final Project

//stores image variables
var explosion;
var lost;
var crash;
var win;
var beginScreen;
var lightning;
var mountain;
var img;

//variable to determine if the game has started
var gameStarted = false;

//position and speed variables for the plane
var xPos = 240;
var yPos = 0;
var xSpeed = 0;
var ySpeed = 0;

//arrays to store the obstacles in
var mountains = [];
var lightnings = [];


function setup() {
    createCanvas(480, 480);
    //load background and obstacle images
    img = loadImage("https://i.imgur.com/x3rvhGU.png");
    lightning = loadImage("https://i.imgur.com/v6p1ANv.png");
    mountain = loadImage("https://i.imgur.com/tLB1n6D.png");
    explosion = loadImage("https://i.imgur.com/8J62X6Z.png");

    //load splash screens
    lost = loadImage("https://i.imgur.com/znFRmOW.png");
    crash = loadImage("https://i.imgur.com/TXv7bto.png");
    win = loadImage("https://i.imgur.com/T0qvSdh.png");
    beginScreen = loadImage("https://i.imgur.com/J34UN7I.png");
    //pushes random coordinates into the obstacle arrays
    for (i = 0; i < 8; i++) {
        lightnings.push(random(0, width));
        lightnings.push(random(80, 350));
        mountains.push(random(0, width));
        mountains.push(random(80, 350))
    }   
}

function draw() {
    imageMode(CENTER);
    //draws background image
    image(img, 240, 240);
    //initializes plane if the game has begun
    if (gameStarted == true){
        ySpeed = 0.5;
    }
    //controls plane's direction
    yPos += ySpeed; 
    xPos += xSpeed;
    //calls function to draw obstacles
    drawObstacles();
    //displays splash screen before the game starts
    if (gameStarted == false) {
        image(beginScreen, width/2, height/2);
    }
    //drawing the airplane
    fill(240);
    strokeWeight(0.5);
    //wings
    ellipse(xPos, yPos, 70, 11); 
    ellipse(xPos, yPos - 20, 35, 8);
    //horz stabilizer
    fill(108, 190, 225);
    ellipse(xPos, yPos, 17, 45); 
    //fuselage
    ellipse(xPos + 17, yPos + 5, 6, 15); 
    //left engine
    ellipse(xPos - 17, yPos + 5, 6, 15); 
    //right engine
    fill(0);
    ellipse(xPos - 17, yPos + 10, 10, 2); 
    //right propeler
    ellipse(xPos + 17, yPos + 10, 10, 2); 
    //left propeller
    fill(240);
    ellipse(xPos, yPos - 25, 5, 17); 
    //tail
    fill(0);
    beginShape(); 
    //cockpit
    vertex(xPos - 5, yPos + 10);
    vertex(xPos, yPos + 17);
    vertex(xPos + 5, yPos + 10);
    vertex(xPos + 5, yPos + 5);
    vertex(xPos, yPos + 10);
    vertex(xPos - 5, yPos + 5);
    vertex(xPos - 5,yPos +  10);
    endShape(); 
    //checks to see if the plane has collided into lightning
    for (i = 0; i < lightnings.length; i += 2) {
        if (dist(xPos, yPos, lightnings[i], lightnings[i+1]) <= 35) {
            gameOver();
        }   
    }
    //checks to see if the plane has collided in mountains
    for (i = 0; i < mountains.length; i += 2) {
        if (dist(xPos + 3, yPos, mountains[i], mountains[i+1]) <= 38) {
            gameOver();
        }   
    }
    //calls landing function if plane crosses top edge of runway
    if (dist(xPos, yPos, 235, 440) <= 15) {
        xSpeed = 0;
        ySpeed = 0;
        landed();
    }
    //calls lost screen function if plane leaves canvas (x)
    if (xPos <= 10 || xPos >= 470) {
        gotLost();
    }
    //calls lost screen function if plane leaves canvas (y)
    if (yPos >= 470) {
        gotLost();
    }
}

//draws the obstacles using randomized values from the arrays
function drawObstacles() {
    for (i = 0; i < lightnings.length; i += 2) {
        image(lightning, lightnings[i], lightnings[i+1]);
        //image(mountain, random(0, width), random(80, 350));
    }
    for (i = 0; i < mountains.length; i += 2) {
        image(mountain, mountains[i], mountains[i+1]);
    }
}

//controls the direction of the plane via arrow keys
function keyPressed() {
    if (keyCode === RIGHT_ARROW) {
        xSpeed = 0.65;
    }
    if (keyCode === LEFT_ARROW) {
        xSpeed = -0.65;
    }
    if (keyCode === DOWN_ARROW) {
        xSpeed = 0;
    }
}

//starts the game
function mousePressed() {
    gameStarted = true;
}

//game over function, displays splash screen
function gameOver() {
    image(explosion, xPos, yPos - 3);
    image(crash, width/2, height/2);
    noLoop();
}

//plane lost function
function gotLost() {
    image(lost, width/2, height/2);
    noLoop();
}

//plane landed function
function landed() {
    image(win, width/2, height/2);
    noLoop();
}

jwchou-Project-Proposal v2

Note: This is my new proposal.

My new proposal is to create an interactive game is controlled by the arrow keys on the keyboard.

I want to create an airplane landing game, sort of inspired by the game/app Flight Control which used to be quite popular. I wanted to do this to continue my series of airplane-themed projects.

I’m imagining that the game will progress either through different levels, or just naturally increase in hardness (ie the planes fly faster, are harder to control, etc). I might try to make it with more than one plane in the frame at a time, but if I can’t execute that, I might just stick with one plane at a time to keep things simple.

The styling will probably be simple and contemporary, and I might explore sound feedback as well, if possible.

I plan to work on this by myself.


jwchou-Project-12-Proposal

I want to create a project that makes politics more visible.

Often, stories break out about President Trump and his policies, but how they may affect people is often unclear. This can be seen in his Muslim Ban, his tweets, or his executive orders, or his diplomatic actions.

I want to create an interactive quiz/poll that shows how Trump might be doing something that directly affects you. For example… qualifiers could be

-being transgender

-being undocumented

-having a specific country of origin

-etc

In addition to being informative to a specific audience, I also want the project to be informative to a more general audience so they can find out how Trump is affecting others.

I’m imagining this project to be a sort of interactive javascript application, where users can click and interact with the different information being presented. I’m a bit hesitant about pursuing this project, because I’m not sure the text formatting tools in P5.Js are powerful enough in order to design a good interface.

Here is an EXTREMELY rough diagram of what it could look like (I promise I have better skills than this). Imagine each box to be a different qualifier, and which one clicks on the box, more information comes up about Trump and his actions.

jwchou-LookingOutwards-12

I think I want to base my project around something political, because I think art/design can be very political.

Here are two simple projects that help make politics most digestable and visible, and I think that is in the vein of what I want to do.

Trump Tracker by Viren Mohindra


This simple website tracks Trump’s promises and highlights them using a color code, depending on if he broke or kept his promise.

Tracking Trump’s Agenda, Step by Step
This is yet another web-based infographic by the New York Times. It shows a chronological timeline of the president’s actions and how they affect people of different populations. Each piece in the timeline links to an article about the specific event.


Both of these are simple web-apps with very primitive interactions. I appreciate how direct they are and how they make following politics more visual and more accessible. However, I think in order for them to be truly effective, they need to be more personalized to the person accessing them. I plan to move in this direction for my project.


jwchou-LookingOutwards-10

EarSketch

A promotional image about EarSketch.

EarSketch is an online web application that teaches students how to code by making music. Users can code in either Python or Javascript. It was created because people thought in order to encourage people to learn how to code and to increase its appeal, they should use a universally understood and loved language: music. I really admire the interface, because it’s modern and fairly simple. If it looked unfinished or overly technical, I imagine that would turn people off from using the app. The app also features a HUGE range of samples, containing everything from dubstep to eight-bit to west coast hip hop.

EarSketch is designed/created by a team that is primarily based out of Georgia Tech.

While the sample themselves might not be computational, users can change the music by setting their own tempo in the code, which is computational. There are also a lot of functions that users can use to analyze tracks for their different properties.

Because the software is used to create music, the creators themselves did not insert any of their own personal artistic sensibilities into the project. Rather, they designed the software in order to allow others to insert their creative sensibilities.

A video that introduces EarSketch:

jwchou-Project10-GenerativeLandscape

I did not understand how to go about doing this project/had no time this week, so I just created something by modifying the template. I thought it would be better to at least post something rather than nothing. it doesn’t quite work, but it’s what I have.


sketch

sketch 90

var planes = [];


function setup() {
    createCanvas(480, 300); 
    
    // create an initial collection of buildings
    for (var i = 0; i < 10; i++){
        var rx = random(width);
        planes[i] = makePlane(rx);
    }
    frameRate(8);
}


function draw() {
    background(20, 51, 137); 
    
    updateAndDisplayPlanes();
    addNewPlanesWithSomeRandomProbability(); 
}


function updateAndDisplayPlanes(){
    // Update the building's positions, and display them.
    for (var i = 0; i < planes.length; i++){
        planes[i].move();
        planes[i].display();
    }
}

function removePlanesThatHaveSlippedOutOfView(){
    // If a building has dropped off the left edge,
    // remove it from the array.  This is quite tricky, but
    // we've seen something like this before with particles.
    // The easy part is scanning the array to find buildings
    // to remove. The tricky part is if we remove them
    // immediately, we'll alter the array, and our plan to
    // step through each item in the array might not work.
    //     Our solution is to just copy all the buildings
    // we want to keep into a new array.
    var PlanesToKeep = [];
    for (var i = 0; i < planes.length; i++){
        if (planes[i].x + planes[i].breadth > 0) {
            planesToKeep.push(planes[i]);
        }
    }
    planes = planesToKeep; // remember the surviving buildings
}


function addNewPlanesWithSomeRandomProbability() {
    // With a very tiny probability, add a new building to the end.
    var newPlaneLikelihood = 0.01; 
    if (random(0,1) < newPlaneLikelihood) {
        planes.push(makePlane(width));
    }
}


// method to update position of building every frame
function planeMove() {
    this.x += this.speed;
}
    

// draw the building and some windows
function planeDisplay() {
    var R = random(100, 200);
    var G = random(100, 200);
    var B = random(100, 200);
    var planeHeight = random(100, 300)
   // var bHeight = this.nFloors * floorHeight; 
    fill(R, G, B); 
    noStroke(0); 
    push();
    translate(this.x, height - planeHeight);
   // rotate(HALF_PI);
    fill(R, G, B);
    beginShape();
    for (var a = 0; a < TWO_PI; a += TWO_PI/5) {
    var sx = 0 + cos(a) * 6;
    var sy = 0 + sin(a) * 6;
    vertex(sx, sy);
    sx = 0 + cos(a + TWO_PI/10) * 14;
    sy = 0 + sin(a + TWO_PI/10) * 14;
    vertex(sx, sy);
  }
  endShape(CLOSE);
   // triangle(40, 40, 45, 50, 50, 40);
    }    

    /*ellipse(40, 40, 70, 11); //wings
    ellipse( 40, 20, 35, 8); //horz stabilizer
    fill(R, G, B);
    ellipse( 40, 40, 17, 45); //fuselage
    ellipse( 57,  45, 6, 15); //left engine
    ellipse( 23, 45, 6, 15); //right engine
    fill(0);
    ellipse( 23, 50, 10, 2); //right propeler
    ellipse( 57, 50, 10, 2); //left propeller
    fill(190);
    ellipse( 40, 15, 5, 17); //tail
    fill(0);
    beginShape(); //cockpit
    vertex(35, 50);
    vertex( 40, 57);
    vertex(45,  50);
    vertex(45,  45);
    vertex( 40,  50);
    vertex( 35,  45);
    vertex( 35, 50);
    endShape();
    pop();*/


function makePlane(birthLocationX) {
    var plane = {x: birthLocationX,
                breadth: 50,
                speed: -2.0,
                move: planeMove,
                display: planeDisplay}
    return plane;
}

jwchou-LookingOutwards-10

A woman interacts with the piece.

Toni Dove  – Artificial Changelins

Toni Dove is a female artist who works with technology to create interactive installations. She lives in New York City. While I couldn’t find information about her formal education, her work centers around interactive cinema and robotics. She is currently working on a retrospective installation.

Her project, Artificial Changelings, is a storytelling piece that follows a romance story set in 19th century Paris. The installation tracks the viewer’s physical location throughout the space, and the viewer can interact with the piece to change parts of the story via the character’s behaviors. I love this project because it sounds so advanced and futuristic, and it’s even more astounding when you realize that she worked on it 20 years ago! Not only is the technology and software impressive, but a lot of artistic thought was put into this as well, since the installation incorporates video. She also devised a very intuitive way of interacting with the exhibit, via stepping to/from four distinct spatial zones on the floor.

Here’s a video:

jwchou-project-09-portrait

sketch 66

var image;
var circleDiam = 15; //diameter of dots


function preload() {
    var URL = "https://i.imgur.com/tOU8IHH.jpg"; //locating image on web
    image = loadImage(URL);
}

function setup() {
    createCanvas(480, 480);
    background(255);
    image.loadPixels();
    frameRate(60); // 60 circles a second
}

function draw() {
	var x = random(width);
	var y = random(height);
	var pixelColor = image.get(x, y); //retrieve color value of pixel;
	noStroke();
	fill(pixelColor); //fill circle with color of pixel at x,y
	ellipse(x, y, circleDiam, circleDiam); //draw circles at random locations
	
	//buttons to make the circles smaller or larger
	fill(180, 244, 180); //green fill
	rect(10, 220, 50, 30); //"smaller" button
	rect(415, 220, 50, 30); //"larger" button
	fill(0); //text fill
	text("smaller", 15, 238);	
	text("larger", 425, 238);

}

function mousePressed() {
	if (mouseX < 60 & mouseX > 10 && mouseY > 220 && mouseY < 250 && circleDiam > 4) {
		circleDiam += -3; //if the mouse is over the smaller button, and the current diameter is greater than 4, make the circles smaller by 3 px
	}

	if (mouseX < 465 & mouseX > 415 && mouseY > 220 && mouseY < 250 && circleDiam < 100) {
		circleDiam += 3; //if the mouse is over the "larger" button, and the current diameter is less than 100, make the circles alrger by 3 px
	}
}

I had trouble at first, because my diameter values were going negative and doing weird things so I tried using constrain() to no avail. Then, I just added a few more conditions to my if() statements, and that worked.

Some possible outcomes:

A portrait rendered with a combination of large and fine dots.

A portrait rendered with finer dots.

This is a portrait of my friend, Amber. Mine uses a very basic element, just circles so I wanted to make it more interactive. Using my highly-advanced HCI skills, I devised a very intuitive interface, consisting of two buttons that say “smaller” and “larger.”
When you click on each corresponding button, the dots get larger or smaller.

I had trouble at first, because my diameter values were going negative and doing weird things so I tried using constrain() to no avail. Then, I just added a few more conditions to my if() statements, and that worked.

Some possible outcomes:

A portrait rendered with a combination of large and fine dots.
A portrait rendered with finer dots.

jwchou-LookingOutwards-09


A screenshot of NYCHenge. The red lines show the streets that align with the sun during ManhattanHenge.

A few weeks ago, my friend Allissa featured NYCHenge in her Looking Outwards post. NYCHenge is a product of Carto, a company that uses location data to help businesses.

It’s a really cool interactive map that displays ManhattanHenge, which happens with the sun’s position is lined up with the city’s east-west streets during sunset or sunrise. The map shows which streets line up with the direction of the sun on a particular day.

Allissa found the project interesting because of how particular and unique its goal was. I agree with her, because it’s often interesting to see projects about something relatively small and intriguing, because so many projects seem to focus on solving big, wicked problems.

I also love projects about mapping, and I’ve written some of my other Looking Outwards posts on projects that use mapping/geography.

Allissa said that non-New Yorkers would probably have trouble identifying the streets, and I fully agree. Another critique I have for the project is that for the tool to be more useful, they could incorporate sunset times and sunset forecasts. Obviously, if it’s going to be overcast, there’s no point to watch the sunset.


jwchou-LookingOutwards-08

Rachel Binx

Rachel Binx is an avid traveler and designer. She has a data visualization background, and finds it natural to convert her experiences to data points to visualize. She has a double degree in math and art history from Santa Clara University (go NorCal!) She works at Netflix currently.

She created a company that creates jewelry, called Meshu, based on geographic locations on a map that people have visited. She found that the backstories/meaning behind the jewelry was intensely meaningful and personal.


Meshu, customized jewelry.

Her work also touches upon manufacturing goods with customized, personal touches using forward looking technologies like 3d printing, and laser-cutting.

Another project of Binx’s is WifiDiary, where she programmed her computer to take a photo of her every single time she connected to a different wifi hotspot.

I really admire how she uses tools and technology to really enhance her projects, such as laser-cutting/3D printing. I’m actually really glad I stumbled upon her work because I love geography, and have always been personally interested in mapping out my own personal experiences. Often, data visualization seems like a lot of heavy statistics, but personalizing it and using it to reflect on your own emotional experiences is a powerful way to use it.

I actually don’t think she’s that effective of a presenter. Her tempo varies a lot, and she seems a bit too nervous about her own work. She should own it more. But she is fine at getting her points across.

Website