![[OLD FALL 2017] 15-104 • Introduction to Computing for Creative Practice](https://courses.ideate.cmu.edu/15-104/f2017/wp-content/uploads/2020/08/stop-banner.png)
var points = 5100;
var depth = 10;
function setup() {
createCanvas(400, 400);
}
function draw() {
background(0);
translate(width /2, height/2);
rotate(mouseX/2);
drawParabolaCurve();
drawHypotrocloid();
}
function drawParabolaCurve() {
strokeWeight(0.1);
stroke(104,259,242);
noFill()
var Z = 6000;
beginShape();
for (var i = 0; i < points; i++) {
var t = map(i, 10, points, 10, HALF_PI);
var x = Z * pow(t,depth) / Z;
var y = 2 * Z * t;
vertex(x, y);
}
endShape();
}
function drawHypotrocloid() {
var e = 100;
var f = map(mouseX, 0, width, 0, 300);
var g = e/map(mouseY, 0, height, 0, 300);
beginShape();
for (var i = 0; i < points; i++) {
var angle = map(i, 0, points, 0, HALF_PI);
var j = (e - f) * cos(angle) + f * cos (((e - g)/g)*angle);
var k = (e - f) * sin(angle) - f * sin (((e - g)/g)*angle);
vertex(j, k);
}
endShape();
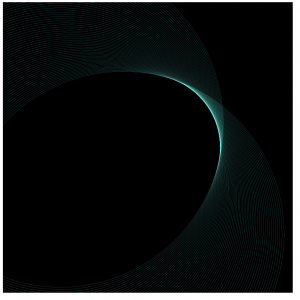
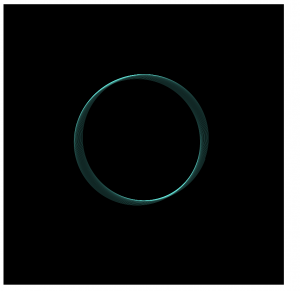
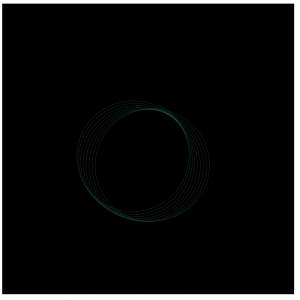
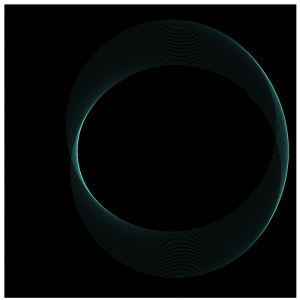
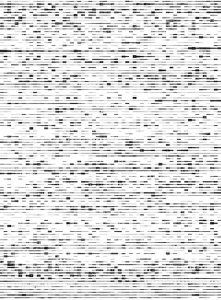
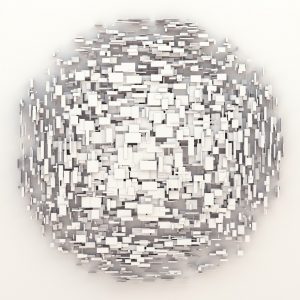
}I usedParabolaCurve and Hypotrocloid in one visual, playing with stroke weight and dynamic behaviors. I like the mysterious, delicate, and sensual visual qualities.