rgroves – Curves – Section B

sketch

var nPoints = 250;
var rotations = 30;
var shift = 0; //initialize displacement of curve, which changes whith the mouse
var a = 0; //initialize a used in the curve function
var red = 50;
var g = 0;
var b = 0;


function setup() {
    createCanvas(480, 480);
    frameRate(10);
}

function draw() {
    background(250);
    stroke(250);
    translate(width/2, height/2);
	var s = (TWO_PI)/rotations;
    for(j = 0; j < rotations; j += 2) {
		drawConchoid(j * s);
	}
	for(j = 1; j < rotations; j += 2) {
		drawConchoid(j * s);
	}
}

function drawConchoid(r) {
	push()
	pickColor();

	rotate(r);
    var shift = map(mouseY, 0, height, -100, 100); //displaces the curve along the rotated x axis using mouseY
	translate(shift, 0);
	beginShape();
	for(i = 0; i < nPoints; i++) {
        var theta = map(i, 0, nPoints, 0, TWO_PI);
	    var a = map(mouseX, 0, width, -5, 4);

        var r = 70 * ((1/(cos(theta))) + (a * cos(theta)));
        var x = r * cos(theta);
        var y = r * sin(theta);
        vertex(x, y);
	}
	endShape(CLOSE);	
	pop();
}

function pickColor() {
	var red = random(60, 200);
	var g = random(50, 150);
	var b = random(80, 250);
	var col = color(red, g, b, 20);
	return fill(col);
}

The curve I chose for the project was the Conchoid of de Sluze. I had a LOT of problems with this code! I wanted to rotate the curve around the center many times to create this complex mandala pattern. While I think that should have been really simple to do with a for loop, nothing I did worked. I kept the for loop that I wrote in the code but it’s commented out. I still do not understand why it doesn’t work!! I also didn’t want the colors to be flashing but I couldn’t figure out how to fix the random values.

Edit: I figured out the problem with the for loop so I updated my post!

rgroves – Looking Outwards-07

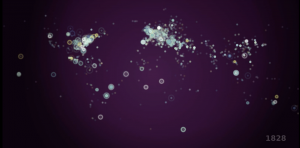
History of the World in 100 Seconds is a video by Gareth Lloyd and Tom Martin that uses data from 14,238 Wikipedia Articles. They pulled out every geotagged article and every reference to an event and cross referenced them to find every events with a corresponding location. In the video, a dot appears corresponding to all 14,238 events chronologically and according to location. At the end, the dots start appearing more and more rapidly like fireworks, and a recognizable map of the world as we know it materializes. The dots also start to resemble how cities look from above as they become more and more clustered. I admire this project both because of how they represented the information graphically, but also for the sheer volume of data they were able to analyze and represent.


https://vimeo.com/19088241

rgroves – Abstract Clock – section B

sketch


var quote = ["All", "time", "is", "all", "time.", "It", "does", "not", "change.",
"It", "does", "not", "lend", "itself", "to", "warnings", "or", "explanations.", "It", "simply", "is.", "Take", "it", "moment", 
"by", "moment,", "and", "you", "will", "find", "that", "we", "are", "all,", "as", "I've", "said", "before",
"bugs", "in", "amber."];

var letters = 360;


function setup() {
    createCanvas(400, 400);
}

function draw() {
    background(220, 170, 125);

	var H = hour();
    var M = minute();
    var S = second();

    
    //floor
    fill(162, 137, 118);
    quad(0, 250, width, 300, width, height, 0, height);
    strokeWeight(40);
    stroke(250, 180, 135);
    beginShape();
    curveVertex(0, 250);
    curveVertex(0, 250);
    curveVertex(width/3, 200);
    curveVertex(2 * width/3, 230);
    curveVertex(width, 300);
    curveVertex(width, 300);
    endShape();
    noStroke();
    

    //window
    fill(240, 190, 135);
    rect(width/3 - 14, 45, 50, 50);
    var time = H + M/60 + S/3600; 

    if (time <= 12) { //window gets light from midnight to noon
        var skyR = map(time, 0, 12, 35, 200);
        var skyG = map(time, 0, 12, 40, 220);
        var skyB = map(time, 0, 12, 70, 235);
        fill(skyR, skyG, skyB);
    }
    if (time >= 12) { //window gets darker from noon to midnight
    	var skyR = map(time, 12, 24, 200, 35);
    	var skyG = map(time, 12, 24, 220, 40);
    	var skyB = map(time, 12, 24, 235, 70);
    	fill(skyR, skyG, skyB);
    }
    rect(width/3 - 15, 45, 30, 30);

    //darkness filter - entire room gets darker from 19:00 to midnight and lighter from midnight to 7:00
    if (time <= 7) {
    	var a = map(time, 0, 7, 200, 0);
        fill(35, 40, 70, a);
    } else 
    if (time >= 19) {
    	var a = map(time, 19, 24, 0, 200);
        fill(35, 40, 70, a);
    } else {
    	var a = 0;
        fill(35, 40, 70, a);
    }
    rect(0, 0, width, height);

    //medallion
    stroke(50, 20, 50);
    strokeWeight(3);
    line(width/3 + 21, height/3 + 1, width/3 + 21, height/3 + 100);
    noStroke();
    fill(175, 110, 20);
    ellipse(width/3 + 20, height/3, 25, 25);
    fill(200, 155, 37);
    ellipse(width/3 + 21, height/3 + 1, 20.5, 20.5);
    fill(150, 50, 100);
    ellipse(width/3 + 21, height/3 + 1, 5, 5);
    for (i = 0; i < 10; i++) {
    	push();
    	translate(width/3 + 21, height/3 + 1);
    	var angle = map(i, 0, 10, 0, 2 * PI);
    	rotate(angle);
    	fill(255, 254, 208);
    	ellipse(0, 7, 2, 2);
    	pop();
    }

    //light from the medallion
    if (time <= 7) { //beam moves across the floor as the sun/moon move across the sky
    	var lightbeam = map(time, 0, 7, 200, 400);
    } else
    if (time >= 19) {
    	var lightbeam = map(time, 19, 24, 0, 200); 
    } else {
    	var lightbeam = map(time, 7, 19, 0, 400);
    }
    if (lightbeam < 200) { //beam becomes more concentrated at noon, midnight
    	var lightbeamwidth = map(lightbeam, 0, 200, 80, 20);
    } else {
    	var lightbeamwidth = map(lightbeam, 200, 400, 20, 80);
    }
    fill(230, 180, 80, 100);
    ellipse(lightbeam, letters, lightbeamwidth, 20);
    var whitelight = color(230, 240, 200, 40);
    var redlight = color(150, 50, 10, 60);
    var redlightheight = map(M, 0, 60, height/3 + 1, letters);
    var lines = 5000
    for(i = 0; i < lines; i++) { //amount of red in the light bean represents minutes in the hour
    	strokeWeight(.1);
    	var leftx = map(i, 0, lines, width/3 + 21, lightbeam - lightbeamwidth/2);
    	var rightx = map(i, 0, lines, width/3 + 21, lightbeam + lightbeamwidth/2);
    	var y = map(i, 0, lines, height/3 + 1, letters);
    	var amt = map(y, redlightheight, letters, 0, 1);
    	var fade = lerpColor(redlight, whitelight, amt);
    	if (y < redlightheight) {
    		stroke(redlight);
    	} else {
    		stroke(fade);
    	}
    	line(leftx, y, rightx, y);
    }

    //light from window
    fill(whitelight);
 	quad(width/3 - 15, 45, width/3 + 35, 45, lightbeam + (5 * lightbeamwidth), height, lightbeam - (5 * lightbeamwidth), height);

 	//words go across the page - quote loops every minute
 	var textspeed = map(S, 0, 60, 0, quote.length); //quote is fewer than 60 words, so have to convert
 	var textspeedinteger = textspeed - (textspeed%1);
 	var textspacing = map(textspeedinteger, 0, quote.length, 0, width - 25);
 	if (dist(textspacing, letters, lightbeam, letters - 5) < 5 * lightbeamwidth) {
 		fill(whitelight);
 	} else {
 		fill(155, 125, 110);
 	}
 	text(quote[textspeedinteger], textspacing, letters - 5, width, 50);

 	
}

For this project I was inspired by the medallion in Indiana Jones that illuminates a point on a map at a certain time of day. The beam of light moves across the screen every 12 hours from 7am to 7pm and 7pm to 7am (as the sun and moon move across the sky) and fills with red every hour. The beam of light is also thinner in the middle of the picture (when the sunlight is most direct) and wider towards the edges. The quote at the bottom cycles every minute and the light through the window represents the time of day. The entire room also gets darker at night. It’s a random Kurt Vonnegut quote about time that I picked, I may think harder about what quote I really want and change it.

rgroves – Looking Outwards-06

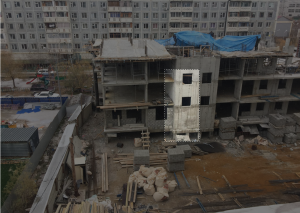
Random Selection in Random Image by Jan Robert Leegt in not a complicated project. It’s a website that selects a random image from Flickr and makes a selects an area of the image of random size and location. I doubt this project required a great deal of thought or effort, but nevertheless it messes with your mind in a really interesting way. Even though I know the selections were made randomly, my mind has to find some significance to the selection so it fills in information that’s not there. This can create an eerie effect – for example in this picture my mind is telling me that someone is looking out at me from those two dark windows.

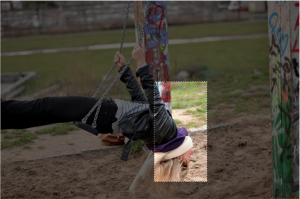
It is also interesting how often the random selection looks less random than if someone was trying to make it look random. For example, in this picture the program happened to select the main subject of the picture.

http://www.randomselectioninrandomimage.com/

rgroves – Wallpaper – section B

sketch

//Becky Groves
//Section B
//rgroves@andrew.cmu.edu
//Project 5 Wallpaper

//dimensions of the pattern
var h = 140;
var w = 200;

function setup() {
    createCanvas(480, 480);  
    background(167, 178, 181);	
}

function draw() {
for (var y = 0; y < height/h; y++){
		for (var x = 0; x < width/w; x++) {
			//change the position of the pattern for each row
			if (y%2 == 0) {
				texas(x * 2 * w, y * h);
				//change the color of the star for each column
				noStroke();
				if (x%3 == 0) {
					fill(255, 255, 255);
				} else
				if (x%2 == 0) {
					fill(255, 0, 0);
				} else {
					fill(0, 0, 255);
				}
				star((x * 2 * w) + w, y * h, 20, 50, 5);
			} else {
				texas(-w + (x * 2 * w), y * h);
				noStroke();
				if (x%3 == 0) {
					fill(0, 0, 255);
				} else
				if (x%2 == 0) {
					fill(255, 255, 255);
				} else {
					fill(255, 0, 0);
				}
				star((x * 2 * w), y * h, 20, 50, 5);
			}
		}
	} 
}


function texas(x, y){ //combine right and left sides of the pattern
	lefttexas(x, y);
	righttexas(x + w, y);
}

function lefttexas(x, y){ //left half of the pattern
	fill(167, 178, 181);
	noStroke();
	rect(x, y, w, h);
	//grass
	fill(142, 130, 78);
	rect(x, y + h - 45, w, 45);
	//windmills
	var a = 25; //distance of first windmill from the left
	var xs = 30; //horizontal spacing
	var yst = 15; //difference in heights from the top
	var ysb = 5; //difference in heights from the bottom
	for (i = 0; i < 3; i++) {
		stroke(223, 218, 207);
		strokeWeight(3);
		line(x + a + (xs * i), y + 30 + (yst * i), x + a + (xs * i), y + h - 10 - (ysb * i));
		line(x + a + (xs * i), y + 30 + (yst * i), x + a + (xs * i) + 6, y + 30 + (yst * i));
		push();
		noStroke();
		fill(223, 218, 207);
		translate(x + a + (xs * i) + 6, y + 30 + (yst * i));
  		rotate(frameCount / 200.0 * (i + 1)); //the blades spin!
  		rotate(45 * (i + 1))
		star(0, 0, 2, 30, 3); 
		pop();
	}
	//fence
	stroke(100);
	strokeWeight(4);
	noFill();
	rect(x + ((11/16) * w), y + 80, (5/16) * w, 50, 10, 0, 0, 10);
	line(x + w - 10, y + 80 + 25, x + w, y + 80 + 25);
	for (i = 1; i <= 4; i++) {
		strokeWeight(2);
		var s = 50/5;
		line(x + ((5/8) * w), y + 80 + (i * s), x + w, y + 80 + (i * s));
	}
	stroke(188, 157, 118);
	strokeWeight(10);
	line(x + ((5/8) * w), y + 80, x + ((5/8) * w), y + h);
}

function righttexas(x, y) {
	push();
	translate(2 * x + w, 0);
	scale(-1, 1);
	lefttexas(x, y);
	pop();
}

//this is from the p5.js reference site
function star(x, y, radius1, radius2, npoints) {
  var angle = TWO_PI / npoints;
  var halfAngle = angle/2.0;
  beginShape();
  for (var a = 0; a < TWO_PI; a += angle) {
    var sx = x + cos(a) * radius2;
    var sy = y + sin(a) * radius2;
    vertex(sx, sy);
    sx = x + cos(a+halfAngle) * radius1;
    sy = y + sin(a+halfAngle) * radius1;
    vertex(sx, sy);
  }
  endShape(CLOSE);
}

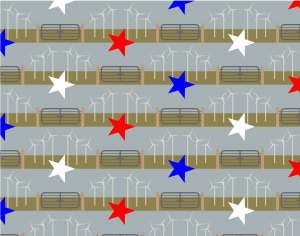
For this project I was inspired by the landscape of my home state Texas. I think it looks better at a larger scale so here’s a screenshot of what that would look like:


rgroves – Looking Outwards 05


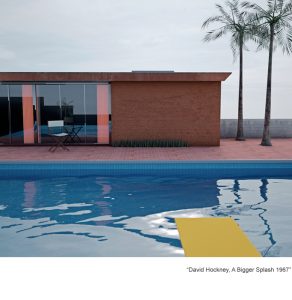
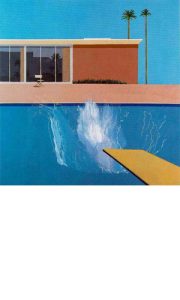
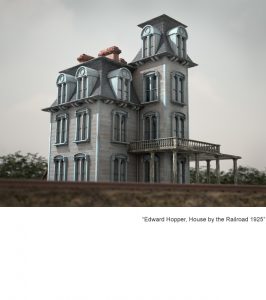
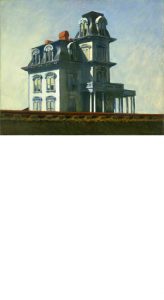
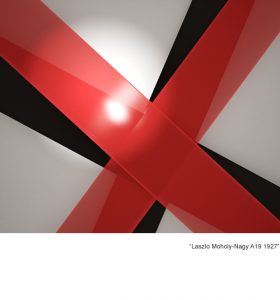
Richard Kolker’s series “Reference, Referents” reverses that convention of using photograph as references for paintings. Instead, he takes famous paintings and uses 3D digital modeling techniques to create synthetic photographs of what the original painters may have been looking at. This project is interesting because it asks the question – if an image is indistinguishable from a photograph, does that make it a photograph? His images are every bit as fabricated as the paintings he’s inspired by, but they are meant to look like reference material.

 .    

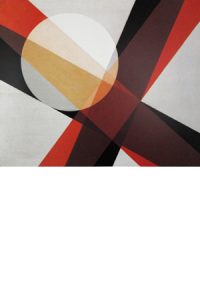
I particularly liked how he rendered Lazlo Maholy-Nagy’s A19, which is not a representational artwork and one would not assume that artist originally worked with a photograph. Kolker’s interpretation of the stripes as ribbons and the discolored area as a spotlight made me see the original work in a totally different way.

http://www.richardkolker.com/refref.htm

rgroves – String Art – Section B

sketch

//Rebecca Groves
//rgroves@andrew.cmu.edu
//Section B
//Project 4 String Art

//sky - position of the ellipses
var x;
var y;

//spacing of the mountains
var m1 = 30;
var m2 = 25;
var m3 = 5; 

//lake spacing
var l = 1;
var k = 1.02; //constant to increase spacing by

//foreground hillsspacing
var f1 = 2;
var f2 = 2.2; 
var a = 260; //top of the back hill
var b = 310; //top of the middle hill
var c = 380; //top of the front hill

function setup() {
    createCanvas(600, 400);
    background(200, 210, 200);
    //sky
    for (var i = 0; i < 5000; i++) {
    	noStroke();
        ellipse(x, y, random(80), random(80));
        x = random(width);
        y = random((2/3) * height);
        if (dist(x, y, 150, 100) < 85) { //make the sky brighter near the sun
        	fill(random(230, 255), random(235, 255), random(225, 240), 75);
        } else {
            fill(random(180, 240), random(180, 255), random(220, 255), 50);
        }
    }
    noLoop(); // turn off looping
    //sun
    fill(255, 245, 180);
    ellipse(150, 100, 20, 20);
}

function draw() {
	//first row of mountains
	for (var i = 0; i < 35; i++) {
		stroke(210, 190, 180);
		strokeWeight(.25);
		line(200, 125, -300 + (i * m1), height);
		line(300, 130, -250 + (i * m1), height);
		line(475, 100, -50 + (i * m1), height);
	}

	//second row of mountains
	for (var i = 0; i < 50; i++) {
		stroke(160, 146, 160);
		strokeWeight(.5);
		line(50, 130, -400 + (i * m2), height);
		line(550, 140, 50 + (i * m2), height);
		line(350, 150, -600 + (i * m2), height);
		line(350, 150, 400 + (i * m2), height);
	}

	//front row of mountains
	for (var i = 0; i < 100; i++) {
		stroke(171 - i , 176 - i, 206 - i); //lighter on the side facing the sun
		strokeWeight(1);
		line(120, 165, -150 + (i * m3), (2/3) * height);
		line(450, 140, 200 + (i * m3), (2/3) * height);
		//reflections in the water
		stroke(120, 125, 170, 70);
		line(120, (4/3) * height - 165, -150 + (i * m3), (2/3) * height);
		line(450, (4/3) * height - 140 , 200 + (i * m3), (2/3) * height);

	}

	//lake
	for (var i = 0; i < 500; i++) {
		stroke(0, 255, 255);
		strokeWeight(.25);
		line(0, (2/3) * height + l, width, (2/3) * height + l);
		l = k * l; //geometrically increase the distance between lines
	}

	//foreground
	for (var i = -50; i < 55; i++) {
		strokeWeight(1);
		stroke(179 - (2 * i), 177 - (2 * i), 75); //brighter on the side facing the sun
		var m = map(i, -50, 40, -1, .5);
		line(375 + ((i + 50) * f2), 280, 420 + ((i + 50) * f1), a);
		a = a + m; //since m goes from negative to positive, this allows the hill to 
		           //slope upward and then downward
	}
		
	for (var i = -80; i < 60; i++) {
		strokeWeight(1);
		stroke(179 - (2 * i), 177 - (2 * i), 75);
		var m = map(i, -80, 60, -1, .5);
		line(310 + ((i + 80) * f2), 330, 350 + ((i + 80) * f1), b);
		b = b + m;
	}

	for (var i = -150; i < 100; i++) {
		strokeWeight(1);
		stroke(179 - (4 * i), 177 - (4 * i), 75);
		var m = map(i, -150, 100, -1, .5);
		line(210 + ((i + 150) * f2), height, 250 + ((i + 150) * f1), c);
		c = c + m;
	}
}

I liked how creating images with lines instead of solid shapes allows for a lot more visual interest. Without even trying to you can wind up with gradients and cool patterns from overlapping lines.

rgroves – Looking Outwards 04

In the summer of 2016, Icelandic ambient rock band Sigur Ros livestreamed a 24 hour journey around Route One, Iceland’s beautiful coastal ring road. The whole video was accompanied by new music from the band – well, new music in collaboration with a generative music program called BRONZE. BRONZE was created in 2011 by Mike Grierson, a scientist at Goldsmith University, and musician Gwilym Gold. It takes a recorded piece of music and is able to infinitely regenerate it in unique transfigurations. As the original recording is played over and over on this platform, it’s impossible to tell when each reiteration starts and ends because segments may be played in a different order, instruments may be amplified or eliminated, some sections are shortened and others elongated, etc. The music becomes ephemeral, as “the chances of hearing the same version of the track versus the chances of winning the lottery don’t even compare,” according to Gold.

This experiment worked extremely well with Sigur Ros’s ethereal sound. The entire spectacular 24 hour journey is available online, but here are the middle 9 hours!

And here is a link to an album by Gwilym Gold, which is only available on BRONZE and no permanently recorded version exists , so you truly can’t hear the music the same way twice. You do have to download a mobile app in order to listen.

http://bronzeformat.com/

rgroves – Dynamic Drawing – Section B

sketch

 var x = 565


function setup() {
    createCanvas(600, 600);
}

function draw() {


//still objects
	rectMode(CORNER);

	//solid shapes for walls and floor
    background(113, 146, 128)
    noStroke();
    fill(96, 129, 118);
    rect(375, 0, width - 375, height);
    fill(119, 89, 79);
    beginShape();
    vertex(0, (1/2) * height);
    vertex(375, (1/2) * height);
    vertex(width, height);
    vertex(0, height);
    endShape();

    //window; slope of top is -1/2, slope of bottom is -3/4
    stroke(230);
    strokeWeight(6);
    fill(209, 213, 207);
    beginShape();
    vertex(390, 50);
    vertex(590, 150);
    vertex(590, 350);
    vertex(390, 200);
    vertex(390, 50);
    endShape();

    //landscape
    noStroke();
    fill(165, 158, 74);
    beginShape();
    vertex(393, 160);
    vertex(420, 150);
    vertex(470, 190);
    vertex(500, 185);
    vertex(520, 200);
    vertex(575, 195);
    vertex(587, 210);
    vertex(587, 344);
    vertex(393, 197);
    vertex(393, 175);
    endShape();

    //sun
    fill(254, 247, 146);
    ellipse(540, 170, 15, 15);

    //window frame
    stroke(230);
    strokeWeight(6);
    line(390, 125, 590, 250);

    //bedframe back
    noStroke();
    fill(115, 73, 74);
    rect(187, 150, 188, 70);
    stroke(100, 60, 60);
    line(190, 150, 372, 150);
    noStroke();
    fill(183, 153, 120);
    rect(187, 135, 15, 185);
    rect(360, 135, 15, 185);

    //mattress 
    fill(36, 68, 116);
    beginShape();
    vertex(367, 235);
    vertex(521, 420);
    vertex(521, 460);
    vertex(228, 460);
    vertex(195, 275);
    vertex(195, 235);
    endShape();

    //pillow
    rectMode(CENTER);
    fill(238, 215, 216);
    rect(281, 225, 80, 60, 15);
    fill(137, 113, 113);
    ellipse(281, 225, 8, 8);
    strokeWeight(2);
    stroke(137, 113, 113);
    line(266, 210, 296, 240);
    line(266, 240, 296, 210);


    //nightstand  
    rectMode(CORNER);
    stroke(187, 82, 49);
    strokeWeight(10);
    line(45, 230, 55, 320);
    line(155, 230, 145, 320);
    stroke(167, 62, 29);
    line(120, 230, 115, 305);
    noStroke();
    fill(187, 82, 49);
    ellipse(100, 230, 120, 36);

//interactive elements

	//left curtain
	fill(147, 75, 103);
	beginShape();
	vertex(385, 35);
	vertex(410, 50);
	vertex(410, 232.5);
	vertex(385, 210);
	endShape();

	beginShape();
	curveVertex(385, 210);
	curveVertex(385, 210);
	curveVertex(387, 225);
	curveVertex(400, 227);
	curveVertex(410, 232.5);
	curveVertex(410, 232.5);
	endShape();

	//right curtain
    if (490 < mouseX & mouseX < 565 & 100 < mouseY && mouseY < 352.5) {
    	quad(595, 140, 595, 375, 
    		mouseX, 352.5 - ((.75) * (565 - mouseX)), 
    		mouseX, 125 - ((.5) * (565 - mouseX)));
    	x = mouseX
    	//make the sunlight fade as the curtain closes
    	fill (242, 235, 177, (8/3) * mouseX - (3920/3)); 
    	quad(195 + 12.5, 265, 360, 265, 400, 325, 195 + 30, 325);
    	quad(195 + 12.5, 265, 195 + 30, 325, 195 + 30, 460, 195 + 12.5, 340);
    	quad(180, 340, 200, 460, 125, 460, 107.5, 340);
	} else {
		quad(595, 140, 595, 375, 
    		x, 352.5 - ((.75) * (565 - x)), 
    		x, 125 - ((.5) * (565 - x)));
    	fill (242, 235, 177, (8/3) * x - (3920/3)); 
    	quad(195 + 12.5, 265, 360, 265, 400, 325, 195 + 30, 325);
    	quad(195 + 12.5, 265, 195 + 30, 325, 195 + 30, 460, 195 + 12.5, 340);
    	quad(180, 340, 200, 460, 125, 460, 107.5, 340);
	}

	//bedframe front
	rectMode(CORNER);
    fill(115, 73, 74);
    rect(220, 350, 313, 90);
    stroke(100, 60, 60);
    line(225, 350, 528, 350);
    noStroke();
    fill(200, 163, 140);
    rect(220, 330, 20, 200);
    rect(513, 330, 20, 200);

    //lamp
	if(dist(115, 192, mouseX, mouseY) <= 40) {
		fill(87, 80, 63);
		ellipse(115, 230, 40, 20);
		rectMode(CENTER);
		rect(115, 211, 10, 37.5);
		fill(98, 131, 139);
		ellipse(115, 192, 50, 25);
		beginShape();
		vertex(90, 192);
		vertex(105, 152);
		vertex(125, 152);
		vertex(140, 192);
		endShape();
		//make the room darker
		rectMode(CORNER);
		fill(65, 78, 120, 150);
		rect(0, 0, 600, 600);
	} else {
		fill(161, 137, 137);
		ellipse(115, 230, 40, 20);
		rectMode(CENTER);
		rect(115, 211, 10, 37.5);
		fill(241, 253, 208);
		ellipse(115, 192, 50, 25);
		beginShape();
		vertex(90, 192);
		vertex(105, 152);
		vertex(125, 152);
		vertex(140, 192);
		endShape();
	}
}

This project turned out to be a lot harder than I expected it to be, and I wasn’t able to include all of the elements I wanted to. As of now, when you hover over the lamp the room gets darker and you can use the mouse to open and close the curtain and the intensity of the sunlight on the bed will change.

I particularly struggled with the curtain – first I couldn’t figure out how to make it move with the mouse and then I couldn’t figure out how to make it stay in the same place when the mouse moved away. I realized that when you translate the origin inside push, pop and try to use mouseX and mouseY, the position contained in them is not translated. That took me about 2 hours to work out!

rgroves – LookingOutwards – 03

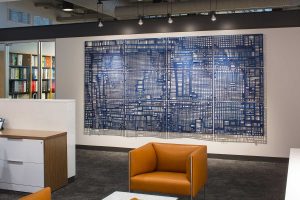
Reading Professor Levin’s article, I found the most interesting parametrically generated art to be the data based projects. It is interesting that the parameters that dictate how the art looks aesthetically are largely out of the artists control. Laurie Frick is a famous data artist, known for her large drawings that map where she walked every day over a long period of time.

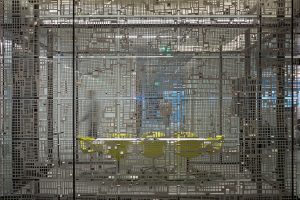
Floating Data (2014-2015) is one entry in this body of work, a 2-story high installation of 60 25x15ft laser cut aluminum panels. She collected data by wearing a GPS tracker, making hand drawn maps, counting steps, noting which places where busy and which were empty, etc. All of the data is aggregated into this colossal transparent map.  While the data itself is mundane and represents routines that we all are familiar with, her fascination with these routines and obsessive documentation of them turn them into something beautiful.

http://www.lauriefrick.com/floating-data/80stjhcg96nxsmldyknon97zteq4kr