![[OLD FALL 2017] 15-104 • Introduction to Computing for Creative Practice](https://courses.ideate.cmu.edu/15-104/f2017/wp-content/uploads/2020/08/stop-banner.png)
//Selina Lee
//Section C
//selinal@andrew.cmu.edu
//Project-07

var nPoints = 70; //amount of elements
var Cissoid = 0; //http://mathworld.wolfram.com/CissoidofDiocles.html
var Conchoid = 0; //http://mathworld.wolfram.com/ConchoidofdeSluze.html

var titles = ["1. Cissoid", "2. Conchoid"];
var curveMode = Cissoid;

function setup() {
    createCanvas(480, 480);
    frameRate(10);
}

function draw() {
	background(255, 160, 60);  //orange background

	translate(240, 240); //place objects or focus on middle
	drawConchoidCurve(); //draw green and pink curves in back
	drawCissoidCurve(); //circles and blue lines in front


}

function drawCissoidCurve() {
	var x; //defining normal plane variables
	var y;

	var a1 = mouseX/20; //containing area of mouse interaction based on size or stretch of curves
	var a2 = mouseY/70;

	stroke(130, 130, 255); //blue lines
	strokeWeight(.5);
	beginShape(); //creating visuals based on Cissoid of Diocles curve
	for (var i = 0; i < nPoints; i++) {
		var t = map(i, 0, nPoints, 0, TWO_PI); //making i obtain to angle which is t

		x = (10 * a1 * sq(t)) / (1 + sq(t)); //formulas for x and y of curve
		// 10 for x and 20 for y were used as constant values based on the composition attained in the index
		y = (20 * a2 * sq(t) * t) / (1 + sq(t));


		fill(250, 240, 220); //off white filling

		vertex(x, y); //draws single curve in normal direction for x and y on an index
		vertex(-x, y); //after adding this vertex, i noticed a greater variation and extension of the curves and lines so I continued this process
		vertex(x, -y);
		vertex(-x, -y);


		for(var ext = 0; ext < x; ext++) { //creating visuals deviating away from the lines but controlled by the same curve

			push(); //contain colors in this for loop not the colors also belonging to the blue line series
			fill(150, 255, 200); //green fill
			ellipse(ext * 10, -y * 5, 10, 10);  //greenish/aqua series of ellipses on top right and bottom left
			ellipse(-ext * 10, y * 5, 10, 10);

			fill(255, 120, 160); //reddish fill
			ellipse(ext * 15, -y * 19, 20, 20); //ellipses accompanying the ones in code written above
			ellipse(-ext * 15, y * 19, 20, 20);
	        pop();
		}

	}
	endShape(CLOSE);
}

function drawConchoidCurve() {
	var x2; //defining second x and y plane variables
	var y2;

	var b1 = mouseX; //containment of lines based on mouse interaction
	var b2 = mouseY;

	stroke(255, 100, 255); //magenta strokes
	strokeWeight(2); //thicker stroke
	beginShape();
	for (var j = 0; j < nPoints; j++) {
		var ang = map(j, 0, nPoints, 0, TWO_PI); //setting the angle value same as var t in the first for loop for the Cissoid of Diocles curve

		x2 = ((1 / cos(ang)) + b1 * cos(ang)) * cos(ang); //formulas for Conchoid de Sluze curve
        y2 = ((1 / cos(ang)) + b2 * cos(ang)) * sin(ang);

        fill(200, 255, 50); //lime green fill

        vertex(x2, y2); // this initial curve also only gave be one shape at first which looked like a flower petal from the center of the frame
        //this shape seemed more centered rather than side oriented like the Cissoid function so I experimented with on other vertex implementation focusing on the center of x
        vertex(-x2, y2); //created an inkblot array type of line series, more angular than round


        push(); // so that other functions not used before like noFill only affect these two vertex
        noFill(); //no fill so there is no overwhelming green
        vertex(x2 * 10, y2 * 10); //creating wider and bigger curve series of the same physical orientation and interaction
        vertex(-x2 * 10, y2 * 10);
        pop();
    }
    endShape(CLOSE);

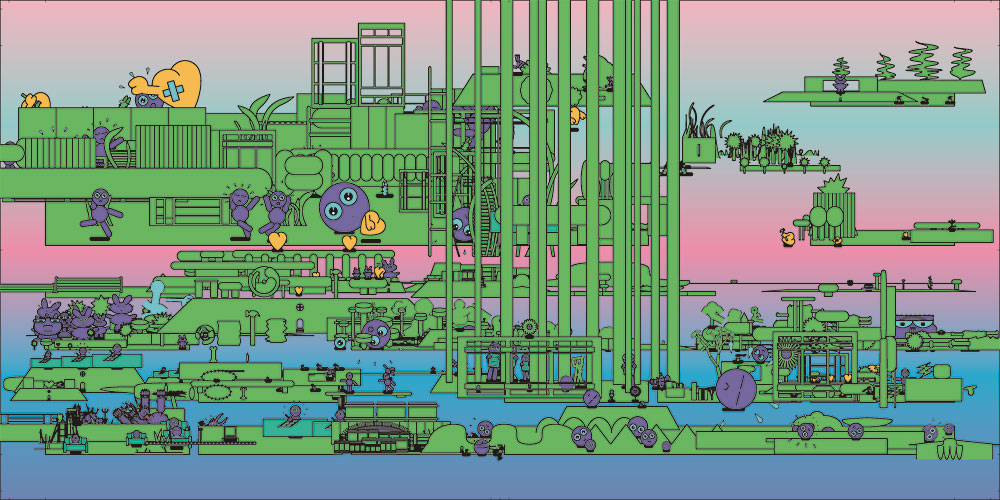
}Author: Selina Lee
selinal-Looking-Outwards-07
Personal Knowledge Database by Moebio Labs (Santiago Ortiz)
http://intuitionanalytics.com/other/knowledgeDatabase/
Moebio Labs is a collaborative team of engineers, analysts, programmers, etc. which has swept through and encountered millions of pages on the internet. While they make most of their data visualizations about a specific topic or theme, their project Personal Knowledge Database acts as an archive for the research they have done throughout the ten years since they started making data visualizations. I admire how they use of old, “unseen” material and incorporate it as a main thematic element in another one of their projects. I think there is a significance in the metaphorical translation of the project’s concept to a visual, and the interactive and technical aspects are extremely impressive. One observation I have of the algorithm used is the separation of certain links/projects into nodes within other nodes, perhaps to indicate time period and area of research.


selinal-Project-06
//Selina Lee
//Section C
//selinal@andrew.cmu.edu
//Project-06

var prevSec;
var millisRolloverTime;
var centX = 300; //center coordinates
var centY = 300;
var numcirc = 12; // number of circles to draw
var distanceS = 250; //distance away from center with second pi clock
var distanceM = 225; //distance away from center with minute pi clock
var distanceH = 175; //distance away from center with hour pi clock
var angle = 0;  //start angle for circle rotation

function setup() {
    createCanvas(600, 600);

    millisRolloverTime = 0;
}

function draw() {
	background(170, 170, 255);

	// Fetch the current time
    var H = hour();
    var M = minute();
    var S = second();

    // Reckon the current millisecond,
    // particularly if the second has rolled over.
    // Note that this is more correct than using millis()%1000;
    if (prevSec != S) {
        millisRolloverTime = millis();
    }
    prevSec = S;
    var mils = floor(millis() - millisRolloverTime);

    var hourArcAngle   = map(H, 0, 23, 0, 360); //angles away from 0 or 12 o'clock
    var minuteArcAngle = map(M, 0, 59, 0, 360);

    // Make a bar which *smoothly* interpolates across 1 minute.
    // We calculate a version that goes from 0...60,
    // but with a fractional remainder:
    var secondsWithFraction   = S + (mils / 1000.0);
    var secondsWithNoFraction = S;
    //var secondBarWidthChunky  = map(secondsWithNoFraction, 0, 60, 0, width);
    var secondArcAngleSmooth  = map(secondsWithFraction,   0, 60, 0, width);

    var strike = radians(270); //so that arcs start at 12:00 placement

    var alphaincS = map(S, 0, 59, 0, 155); //increase transparency from full circle
    var alphaincM = map(M, 0, 59, 0, 105);
    var alphaincH = map(H, 0, 23, 0, 105);

    noStroke();
    fill(255, 230, 130, 100 + alphaincS);
    arc(centX, centY, 500, 500, strike, radians(secondArcAngleSmooth) + strike); //yelllow outside circle for seconds

    fill(255, 180, 130, 150 + alphaincM);
    arc(centX, centY, 450, 450, strike, radians(minuteArcAngle) + strike); //orange circle for minutes

    fill(255, 150, 130, 150 + alphaincH);
    arc(centX, centY, 350, 350, strike, radians(hourArcAngle) + strike); //red circle for hours by 24

    var angleObjectS = 360/numcirc; //divides circles evenly on outside
	for (var i = 0; i < numcirc; i++) //for loops for making circles revolve around center point
	{
		var posX = centX + distanceS *cos( radians(angleObjectS*i + angle) );
	var posY = centY + distanceS *sin( radians(angleObjectS*i + angle) );
	fill(255, 0, 0, 50);
	ellipse(posX, posY, 30, 30);
	}

	var angleObjectM = 360/numcirc;
	for (var i = 0; i < numcirc; i++)
	{
	var posX = centX + distanceM *cos( radians(angleObjectM*i + angle) );
	var posY = centY + distanceM *sin( radians(angleObjectM*i + angle) );
	fill(255, 150, 0, 50);
	ellipse(posX, posY, 30, 30);
}
	var angleObjectH = 360/numcirc;
	for (var i = 0; i < numcirc; i++)
	{
	var posX = centX + distanceH *cos( radians(angleObjectH*i + angle) );
	var posY = centY + distanceH *sin( radians(angleObjectH*i + angle) );
	fill(255, 255, 0, 50);
	ellipse(posX, posY, 30, 30);
}
}
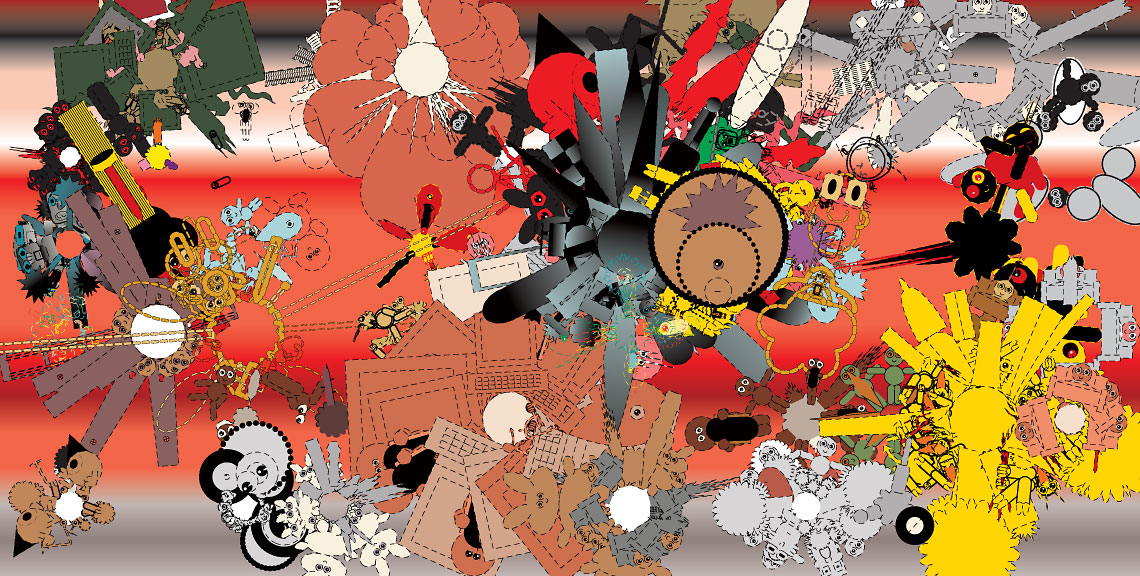
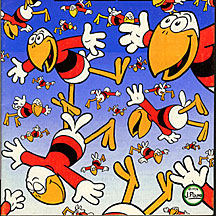
selinal-Looking-Outwards-06
Pound Art Comics by John Pound
http://www.poundart.com/art/randcomix/about.html
John Pound uses his self-developed software to create comics or 2D works derived off of randomization of visual elements. His development of his practice and view of his programs is interesting in that he uses programs “not as a passive tool, like an airbrush, but as an active partner in making creative decisions” (Pound). I appreciate the abstraction and subjectivity of computing in this manner. While the random visuals produced look as if they were just performed by a random function in a 2D coordinate plane, Pound keeps the fabrication of his code and software to himself but says it is coded in PostScript. The visuals look as if there is a constant and a constraint of variables with a simple random variable to add variation. That way, there is a consistency in characters/characteristics but a slight change in illustration that adds presence and personality.
selinal-Project-05
//Selina Lee
//Section C
//selinal@andrew.cmu.edu
//Project-05

function setup() {
    createCanvas(480, 360);
    background(255, 255, 120); //light yellow background

    for(var row = 0; row < 60; row++) { //creating grid of 60x80 for design
    	for(var col = 0; col < 80; col++) {
    		stroke(230, 230, 150, 40); //light beige stripes
    		strokeWeight(3);
    		line(col*6 + 3, 0, col*6 + 3, width); //spacing the stripes 6 units apart and centering the space by three units from the origin

    		push(); //start of a rotation
    		noStroke();
    		fill(255, 200, 150, 150); //orange hue
    		rotate(radians(32)); //rotate the shape by 32 degrees
    		ellipse(row * 20 + 12, col * 40 - 260, 7, 3); //diagonal rows of ellipses more in the horizontal direction that are 20 units apart
    		rotate(radians(70)); //rotate shape by 70 degrees so that it is in a more upward direction
    		ellipse(row * 20 - 80, col * 40 - 800, 6, 2); //shifting the ellipse lines up and over to the right more
    		pop(); //confining the rotation
    	}
    }

    for(var petalx = 0; petalx < 4; petalx++) { //creating flowers with 4 columns
    	for(var petaly = 0; petaly < 3; petaly++) { //flowers in 3 rows
    		noFill();
    		stroke(180, 230, 100); //green flower stems
    		strokeWeight(3); //stroke weight of 3
    		beginShape();
    		curveVertex(petalx * 120 + 75, petaly * 120 + 50); //flower stem starting at center point of white ellipse (see below)
    		curveVertex(petalx * 120 + 75, petaly * 120 + 50);
    		curveVertex(petalx * 120 + 65, petaly * 120 + 70); //midpoints of stem where curve shape happens
    		curveVertex(petalx * 120 + 65, petaly * 120 + 90); //other mid point
    		curveVertex(petalx * 120 + 70, petaly * 120 + 110); //finishing point below main shape of flower
    		curveVertex(petalx * 120 + 70, petaly * 120 + 110);
    		endShape();

    		noStroke();

    		fill(255, 255, 250); //main off-white flower center
    		ellipse(petalx * 120 + 75, petaly * 120 + 50, 10, 10); //centerpoint

    		fill(200, 100, 255, 130); //indigo color of flower with 130 transparency to fit in better with opposing color of yellow
    		ellipse(petalx * 120 + 65, petaly * 120 + 45, 20, 5); //three horizontal ellipse petals
    		ellipse(petalx * 120 + 60, petaly * 120 + 50, 20, 5);
    		ellipse(petalx * 120 + 65, petaly * 120 + 55, 20, 5);

    		ellipse(petalx * 120 + 80, petaly * 120 + 40, 5, 20); // three vertical ellipse petals to show series of abstraction in flower
    		ellipse(petalx * 120 + 85, petaly * 120 + 50, 5, 20);
    		ellipse(petalx * 120 + 80, petaly * 120 + 60, 5, 20);

    	}
    }

    noLoop();

}

function draw() {
}
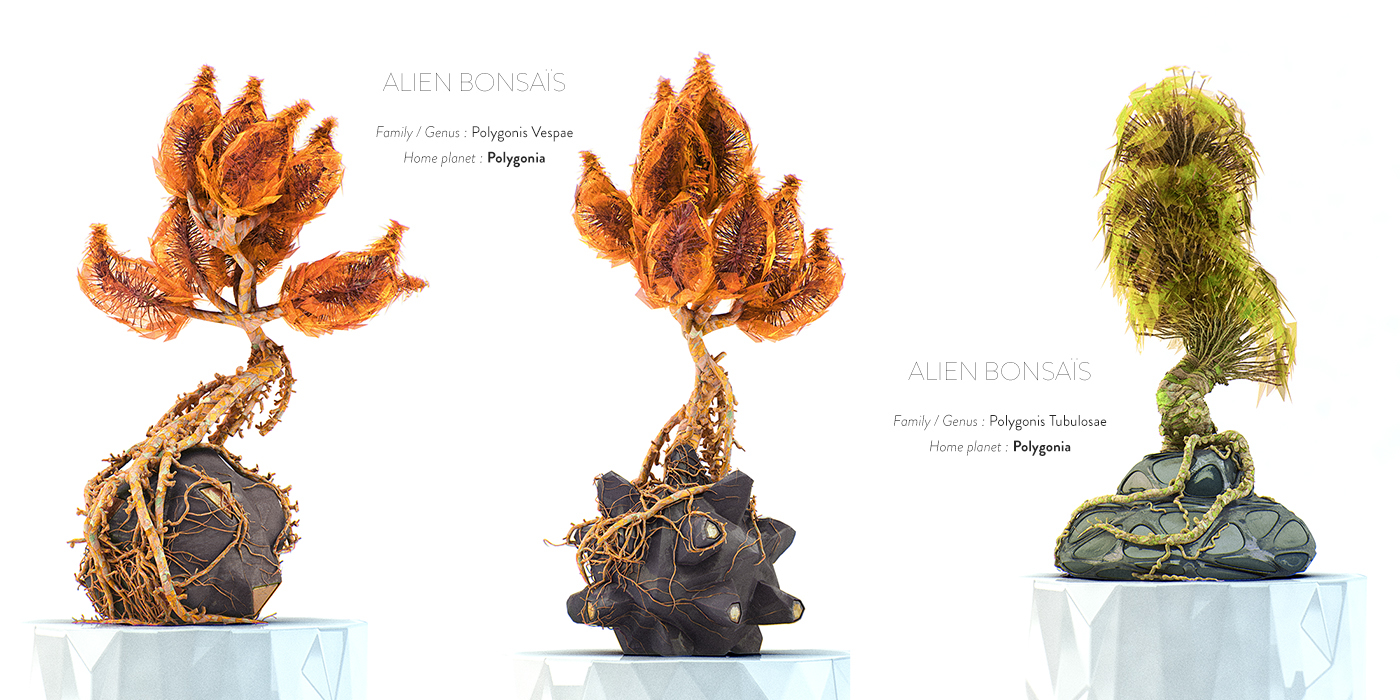
selinal-Looking-Outwards-05
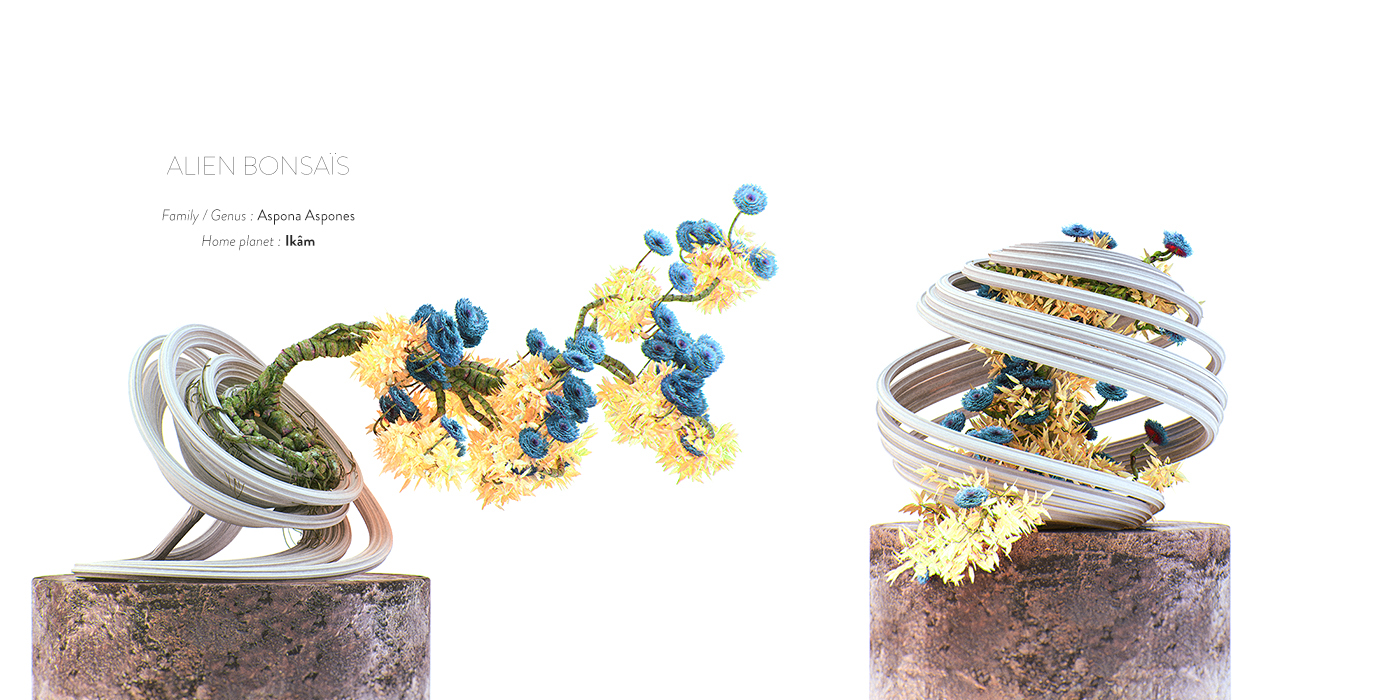
Alien Bonsais by Chaotic Atmospheres
http://chaoticatmospheres.com/alien-bonsais
What I admire about this project are the organic structures, shapes, etc. created to as an inorganic iteration of a bonsai tree. In a way, Chaotic Atmospheres is creating a sculpture on the bonsai tree digitally which would be too difficult to manifest physically on a real, living organism. Thus, that makes the shapes created in relation to the tree a true “alien” visual. What I know of the algorithms used for this project is that the artist used a 3D software called Substance Designers which he embedded onto his own digital trees to create the alien texturing of his bonsais. His artistic sensibilities were utilized in the organization of constructing the digital trees and altering the tones, color, shapes, sizing, movement, etc. of the product so that the image was cohesive and aesthetically intriguing.
selinal-Project-String Art-04
My process for creating these visuals was first to cement a series of curves in a “random” line and balance that series with other curves series based on the location and spread of the first.
//Selina Lee
//Section C
//selinal@andrew.cmu.edu
//Project-04

function setup() {
    createCanvas(400, 300);
    background(250, 220, 130); //faint yellowish background

    noStroke();
    fill(200, 220, 170, 120); //greenish arced shadow on right lower corner
    ellipse(400, 320, 550, 400);

    for(var line1x = 0; line1x < width; line1x += 15) { //initial red series of curves with increments of 15
    	fill(200, 210, 110, 120); //greenish light color to fill curve shapes
    	stroke(250, 70, 20); // red line
    	curve(line1x, line1x, line1x * 10, 100, line1x * 2.5, 200, line1x * 2, height);

    	curve(line1x - 15, height*1.5, line1x * 10 + 20, 220, line1x/2, 50, line1x * 2, 0);

    	curve(line1x/5, 0, -line1x, 0, line1x, 75, line1x + 50, 200);

    	curve(line1x, -100, -line1x/5, 100, line1x*10, 0, line1x + 50, 200);
    }

    for(var line2x = 6; line2x < width; line2x += 15) { //yellow series of curves with increments of 15 but starting more right
    	noFill();
    	stroke(250, 200, 0);
    	strokeWeight(2);
    	curve(line2x, line2x, line2x * 10, 100, line2x * 2.5, 200, line2x * 2, height*2); //thicker top set

    	strokeWeight(1);
    	curve(line2x - 15, height, line2x * 10 + 20, 220, line2x/2, 50, line2x * 2, 0);

    	strokeWeight(.5);
    	curve(line2x/5, 0, -line2x, 0, line2x, 75, line2x + 50, 200); //diminishing bottom sets that overlap with red series and green fills

    	curve(line2x, -100, -line2x/5, 100, line2x*10, 0, line2x + 50, 200);
    }

    for(var line3x = 0; line3x < width; line3x += 20) { //linear series with larger increments of 20
    	stroke(255, 180, 10);
    	strokeWeight(1.5);
    	line(line3x, height +20, line3x*2.3, 200 - line3x/15); //evened out yellow lines on bottom of canvas

    	line(line3x, height+20, line3x*1.8, 180 - line3x/15);

    	line(line3x, height + 20, line3x * 2, 190 - line3x/ 15);

    	fill(200, 50, 0, 150);
    	ellipse(line3x*2, 190 - line3x/15, 10, 10); //ellipse series of red circles

    }
    for(var circle4 = 220; circle4 < width; circle4 += 30) { //ellipse series from right half of canvas to balance out exponential series of red circles
    	fill(200, 50, 0, 150);
    	ellipse(circle4, 190 - circle4/15, 10, 10);
    	ellipse(circle4, 210 - circle4/25, 10, 10);
    }
    for(var line4y = 0; line4y < height; line4y += 15) { //vertical curve series to balance out horizontal strokes
    	fill(200, 100, 10, 50); // orange color with 50 percent transparency
    	curve(width, line4y, 250, line4y, 100, line4y, 0, height - line4y);
    }
}

function draw() {
}selinal-LookingOutward-04
Bending the Arc by Jennifer Wen Ma
https://fluxprojects.squarespace.com/jennifer-wen-ma/
This sound art installation by Jennifer Wen Ma uses the combined voice frequencies of participants speaking into a microphone to raise the visual of the arc. What I admire about this project is the input of interaction in that more participation and louder singing/ speaking, etc. generate a collaborative effort to “raise the arc,” which allows audience members to reflect the action they are performing metaphorically. I was not able to find any explanations of the algorithms Ma used, but what I can assume from witnessing the piece and researching it is that the height of sound frequency is translated to the bending points in the curve drawn, which moves the line up and down.


selinal-Project-03
//Selina Lee
//Section C
//selinal@andrew.cmu.edu
//Project-03

var cx = 320; //center points for canvas
var cy = 240;

function setup() {
    createCanvas(640, 480);

}

function draw() {
	background(50); //off black background

	var x = mouseX; //easy to write mouse variables and to be used in other functions
	var y = mouseY;

	var colorx = mouseX%255; //variables to alter color on canvas without going over 255 RGB limit
	var colory = mouseY%255;

	var oppy = width/2 - mouseY; //reacts opposite of other part in the y direction

	var rad = dist(cx, cy, x, y); //creating area between center point and outerpoint of ellipses for interaction

	//upward and downward moving rectangles
	fill(colorx, 200, colory);
	rect(0, y, 320, 480);

	fill(colory, 200, colorx);
	rect(320, oppy, 320, 480);

	//series of ellipses changing size and color
	fill(colorx, 200, 200);
	ellipse(cx, cy, rad + 150, rad + 150);

	fill(200, colorx, 200);
	ellipse(cx, cy, rad + 140, rad + 50);

	fill(200, 200, colorx);
	ellipse(cx, cy, rad + 50, rad + 140);

	fill(colory, 200, 200);
	ellipse(cx, cy, rad, rad);

	fill(200, colory, 200);
	ellipse(cx, cy, rad - 20, rad - 40);

	fill(200, 200, colory);
	ellipse(cx, cy, rad - 40, rad - 20);

	//series of lines to follow mouse with
	stroke(colory, colorx, colory);
	line(cx, cy, x, y);
	stroke(colorx, 200, 200);
	line(cx, cy, x + 5, y + 5);
	stroke(colorx, colory, 200);
	line(cx, cy, x - 5, y - 5);
	stroke(colory, 200, 200);
	line(cx, cy, x + 5, y);
	stroke(200, colorx, 200);
	line(cx, cy, x - 5, y);
	stroke(200, 200, colory);
	line(cx, cy, x, y + 5);
	stroke(200, colory, colorx);
	line(cx, cy, x, y - 5);

	stroke(colorx, 200, 200);
	line(cx, cy, x + 15, y + 15);
	stroke(colorx, colory, 200);
	line(cx, cy, x - 15, y - 15);
	stroke(colory, 200, 200);
	line(cx, cy, x + 15, y);
	stroke(colory, 200, 200);
	line(cx, cy, x - 15, y);
	stroke(200, 200, colory);
	line(cx, cy, x, y + 15);
	stroke(200, colory, colorx);
	line(cx, cy, x, y - 15);

	stroke(colorx, 200, 200);
	line(cx, cy, x + 25, y + 25);
	stroke(colorx, colory, 200);
	line(cx, cy, x - 25, y - 25);
	stroke(colory, 200, 200);
	line(cx, cy, x + 25, y);
	stroke(colory, 200, 200);
	line(cx, cy, x - 25, y);
	stroke(200, 200, colory);
	line(cx, cy, x, y + 25);
	stroke(200, colory, colorx);
	line(cx, cy, x, y - 25);

	stroke(colorx, 200, 200);
	line(cx, cy, x + 35, y + 35);
	stroke(colorx, colory, 200);
	line(cx, cy, x - 35, y - 35);
	stroke(colory, 200, 200);
	line(cx, cy, x + 35, y);
	stroke(colory, 200, 200);
	line(cx, cy, x - 35, y);
	stroke(200, 200, colory);
	line(cx, cy, x, y + 35);
	stroke(200, colory, colorx);
	line(cx, cy, x, y - 35);

	stroke(colorx, 200, 200);
	line(cx, cy, x + 45, y + 45);
	stroke(colorx, colory, 200);
	line(cx, cy, x - 45, y - 45);
	stroke(colory, 200, 200);
	line(cx, cy, x + 45, y);
	stroke(colory, 200, 200);
	line(cx, cy, x - 45, y);
	stroke(200, 200, colory);
	line(cx, cy, x, y + 45);
	stroke(200, colory, colorx);
	line(cx, cy, x, y - 45);

	stroke(colorx, 200, 200);
	line(cx, cy, x + 55, y + 55);
	stroke(colorx, colory, 200);
	line(cx, cy, x - 55, y - 55);
	stroke(colory, 200, 200);
	line(cx, cy, x + 55, y);
	stroke(colory, 200, 200);
	line(cx, cy, x - 55, y);
	stroke(200, 200, colory);
	line(cx, cy, x, y + 55);
	stroke(200, colory, colorx);
	line(cx, cy, x, y - 55);

	stroke(colorx, 200, 200);
	line(cx, cy, x + 65, y + 65);
	stroke(colorx, colory, 200);
	line(cx, cy, x - 65, y - 65);
	stroke(colory, 200, 200);
	line(cx, cy, x + 65, y);
	stroke(colory, 200, 200);
	line(cx, cy, x - 65, y);
	stroke(200, 200, colory);
	line(cx, cy, x, y + 65);
	stroke(200, colory, colorx);
	line(cx, cy, x, y - 65);

	stroke(colorx, 200, 200);
	line(cx, cy, x + 75, y + 75);
	stroke(colorx, colory, 200);
	line(cx, cy, x - 75, y - 75);
	stroke(colory, 200, 200);
	line(cx, cy, x + 75, y);
	stroke(colory, 200, 200);
	line(cx, cy, x - 75, y);
	stroke(200, 200, colory);
	line(cx, cy, x, y + 75);
	stroke(200, colory, colorx);
	line(cx, cy, x, y - 75);

	stroke(colorx, 200, 200);
	line(cx, cy, x + 85, y + 85);
	stroke(colorx, colory, 200);
	line(cx, cy, x - 85, y - 85);
	stroke(colory, 200, 200);
	line(cx, cy, x + 85, y);
	stroke(colory, 200, 200);
	line(cx, cy, x - 85, y);
	stroke(200, 200, colory);
	line(cx, cy, x, y + 85);
	stroke(200, colory, colorx);
	line(cx, cy, x, y - 85);
}
The visuals for this project are based on a shadowed ray (the array assortment of lines which follow the position of the mouse but extend from the center of the canvas). The rest of the visuals were based on the centripetal movement of the lines, hence the creation of the ellipse series and their opposition to each other depending where mouseX and mouseY are. I noticed the project resembled an eye which was not intentional, but in order to balance the familiarity of the ellipses, the sliding blocks in the background were added as a more linear and angular contrast.
selinal-LookingOutwards-03
Water-Based Additive Manufacturing
https://www.media.mit.edu/projects/water-based-additive-manufacturing/overview/
This research project investigates the creation and feasibility of a new type of digital fabrication that is based around water and utilizes additive manufacturing (AM) which will allow for gradually built, small to large-scale structures. Because of its basis around water, this method of fabrication utilizes the incorporation of biomaterial and organic aggregates which allows for a more sustainable and eco-friendly means of production. I admire the change in materiality of this project because it aims to solve issues of construction and degradation all together. What I know of the algorithms used for this research project is that they are not as geometrically sound. Primary methods of digital fabrication are centered around geometrics which use more energy to construct and are unstable. This new method uses an organic algorithm in terms of shape and additive layers.
