haewanp – Project 04 – String Art

String Art

//Hae Wan Park
//15104-A
//haewanp@andrew.cmu.edu
//Project-04-StringArt

//radius of imaginary circle that its boundary contains X, Y coordinate of beginning or ending point of lines
//radius of some ellipses
var r1 = 110; 
var r2 = 90;
var r3 = 55;
var r4 = 40;

//X, Y coordinate of beginning or ending point of lines
var x1;
var y1;
var x2;
var y2;
var x3;
var y3;

function setup() {
    createCanvas(400, 300);
}

function draw() {
    background(255);
    translate(width/2, height/2);
    
    //circle yellow 1
    noStroke();
    fill(255, 220, 100);
    ellipse(0, 0, 2*r1, 2*r1);
    //circle yellow 2
    fill(255, 240, 100);
    ellipse(0, 0, 210 + r4/3, 210 + r4/3);
    //circle green
    fill(211, 229, 212);
    ellipse(0, 0, 180, 180);
    //circle blue
    fill(0, 50, 130);
    ellipse(0, 0, r4*2, r4*2);
    
    angleMode(DEGREES);
    strokeWeight(1);
    
    //along the boundary of imaginary circle, lines are created in each 5 degree
    for (var a = 0; a < 360; a = a + 5) {
        x1 = cos(a) * r1;
        y1 = sin(a) * r1;
        x3 = cos(a) * r3;
        y3 = sin(a) * r3;
        
        stroke(242, 109, 98);
        line(x1, y1, -cos(a - 110) * r1, -sin(a - 110) * r1);
        line(x3, y3, -cos(a - 90) * r4, -sin(a - 90) * r4);
    }
    
    //along the boundary of imaginary circle, lines are created in each 10 degree
    for (a = 0; a < 360; a = a + 10) {
        x2 = cos(a) * r2;
        y2 = sin(a) * r2;
        x3 = cos(a) * r3;
        y3 = sin(a) * r3;

        stroke(255, 240, 100);
        line(x2, y2, x3, y3);
        stroke(0, 50, 130);
        line(x3, y3, -cos(a - 80) * r4, -sin(a - 80) * r4); 
    } 
    
    //change size of radius based on position of mouse
    r4 = map(mouseY, 0, 300, 30, 80); 
    r1 = map(mouseX, 0, 400, 70, 170);

    //if press mouse radius increases then release radius decrease
    if (mouseIsPressed){
        r2 = r2 + 10;
    } else {
        if (r2 > 90) {
            r2 = r2 - 5;
        }
    }  
    
    //blue lines around canvas
    stroke(0, 50, 130);
    for (var i = -30; i < 30; i++) {
        line(-150, i*17, i*17 - 120, 150);
        line(150, i*17, i*17 + 120, -150);
        line(-150, i*17, -i*17 - 120, -150);
        line(150, -i*17, i*17 + 120, 150);
    }

}

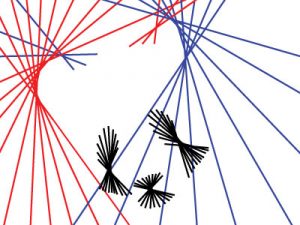
The process was a bunch of geometry to calculate the X, Y coordinate of lines which are created along imaginary circles. I created the animation based on the mouse behaviors. Especially, I like that raylike lines are stretched out when the mouse is pressed.

ssontag-Project-04

For this project i struggled with creating something visually exceptional because of my limited knowledge of how to use for loops to create interesting visuals. So i added a animation aspect using the position of the mouse to determine the visuals.

sketch


function setup() {
    createCanvas(400, 300);
}

function draw() {
    background(210);
//i used a for loop to iterate the value of i so i could create a
//curve made from lines that have an incremental value based on i
    for (var i = 0; i <= 300; i += 20) {
//using the x value of x i made two sets of lines that are connected at the x value of the mouse
// by making two sets the curves can be moved from the left side to the right side of the canvas
        stroke(0, 128, 128);
        line(i, 0, mouseX, height - i);
        line(i, 300, mouseX, i);

        stroke(0, 0, 128);
        line(width - i, 0, mouseX, height - i);
        line(width - i, 300, mouseX, i);

//using the y value of y i made two sets of lines that are connected at the y value of the mouse
// by making two sets the curves can be moved from the top to the bottom of the canvas
        stroke(128, 128, 0);
        line(0, height - i, width- i, mouseY);
        line(400, height - i, i, mouseY);

        stroke(0, 128, 0);
        line(0, i, width - i, mouseY);
        line(400, i, i, mouseY);
    }
}

Project-04-String-Art

sketch

//Hanna Jang 
//Section B 
//hannajan@andrew.cmu.edu 
//Project 04

function setup() {
	createCanvas (400, 300); 
    strokeWeight(1); 
    
}

function draw() {
	background(0); 
	var x1= 200; 
	var accum= 2; 
	var space= 40; 
	
 	for (var i = 0; i < 300; i += 40) {
    	//white lines start on left and spread out
    	stroke(255); 
      line (0, 0, width, i); 
      //white lines start on right and spread out 
      line(width, 0, 0, i)
      
      //pink lines start on left and spread out
      stroke(255, 183, 221); 
      line(0, space, width, i); 
      //pink lines start on right and spread out 
     line(width, space, 0, i); 
     
      //yellow lines start on left and spread out 
      stroke(255, 241, 150); 
      line(0, space*2, width, i); 
      //yellow lines start on right and spread out 
      line(width, space*2, 0, i); 
      
      //blue lines start on left and spread out 
      stroke(183, 222, 255); 
      line(0, space*3, width, i); 
      //blue lines start on right and spread out 
      line(width, space*3, 0, i); 
      
      //aqua lines start on left and spread out
      stroke(183, 253, 255); 
      line(0, space*4, width, i); 
      //aqua lines start on right and spread out
      line(width, space*4, 0, i); 
      
      //green lines start on left and spread out
      stroke(151, 231, 182); 
      line(0, space*5, width, i); 
      //green  lines start on right and spread out
      line(width, space*5, 0, i); 
      
      //purple lines start on left and spread out
      stroke(161, 170, 245); 
      line(0, space*6, width, i); 
      //purple  lines start on right and spread out
       line(width, space*6, 0, i); 
       
       //hot pink line starts on left and spreads out
       stroke(243, 62, 150); 
       line(0, space*7, width, i); 
        //hot pink line starts on right and spreads out
      line(width, space*7, 0, i); 
      
    }


}


For this particular project, I was stuck at first on what I should do. I then wanted to try to make a visual illusion. The curves in my project are seen in the middle of the canvas where there are black spots. If you concentrate on the black spots only and move your eyes hori

Brandonhyun- Project-04-String-Art

I was trying to emulate wave shapes and the movement of waves in this project. When the mouse is moved through the x axis, the strings are elongating towards the right of the canvas and when the mouse is moved through the y axis then the strings elongating downwards.

When the mouse is clicked the background color changes.

sketch

// Brandon Hyun
// 15-104 Section B
// bhyun1@andrew.cmu.edu
// Project 04

var increase = 15;
var xInt = 15;

var x1 = 0;
var y1 = 550;
var x2 = 550;
var y2 = 0;
var red;
var green;
var blue;

function setup() {
  createCanvas(400, 300);
}

function draw() {
  background (red,green,blue);
  var m = 400/25;
	for(var i = 0; i < m; i += 1) {
        strokeWeight(1);
		    stroke(40,40,40);


        for(var j =0; j<10; j+=1){
          line(mouseX+40*j, increase * i, increase * i +40*j, y1);
        }

		    for(var z =0; z<10; z+=1){
          line(mouseY+ x2 - increase * i, y2+40*z, x1, increase * i+ 40*z);
        }

	}
}

function mousePressed() {
  red = random(0,255);
  green = random (0,255);
  blue = random (0,255);
}

ssharada-project-04-section-a-string-art

project04-1.js


//Shariwa Sharada
//Section-A
//ssharada@andrew.cmu.edu
//Project-04

var gap = 1; //spacing between lines 
var x1 = 0; //starting point x
var x2 = 200; //mid-point x
var x3 = 400 //endpoint x
var y1 = 150; //midpoint y 
var y2 = 0; //starting point y
var y3 = 300; //end point y 


function setup(){
	createCanvas(400,300);
	strokeWeight(1); //predetermining the stroke weights of everything 	
}

function draw(){
	background(255, 247, 213);

	gap = map(mouseY, 0, 300, 3, 10);//mapping the gap size so that it is proportionate no matter the placement of the mouse
	
	var g = 150; //changing the green value
	var b = 100; //changing the blue value
	var r = 50; //changing the red value

	
	for (var i= 0; i< width; i++){ 
		
		//creating the first pair of dark green to yellow curves 
		stroke(r,g,0);
		line (x1, gap*i, gap*i, y1);//creating lines based of the start and mid points
		line (x2, gap*i, gap*i, y2);
		g += i/20; //creating a gradation in the colour range in terms of the increment
		r += i/10;

		//creating the second pair of yellow to dark green curves 
		stroke(r,g,0);
		line (gap*i, height-y1, width-x1, gap*i); //creating lines based of the end and mid points
		line (gap*i, height-y2, width-x2, gap*i);
		g += i/2;//creating a gradation in the colour range in terms of the increment
		r += i/4;
	}

	//creating the third pair of green to blue curves 
	for (var j= 0; j< width; j++){
		stroke(0,g,b);
		line (x3, gap*j, gap*j, y1); //creating lines based of the end and mid points
		line (x1, gap*j, gap*j, y3);
		g += j/20; //creating a gradation in the colour range in terms of the increment
		b += j;


	}


}

The main aim of my work was to examine the difference between larger increments and smaller increments while trying to vanish some lines into the background and keeping focus on a few of them. I wanted to explore this idea because I found it fascinating how the lines when they come together form this dense intrinsic pattern of curves that you could never imagine that they could come from straight lines – but as you drag the mouse away, you realise what actually creates the lines and it makes you wonder about the complexity of everyday simple objects like curves

dnoh-sectionD-project4-stringart

I attempted to create a panda using lines. I first created a sketch on Adobe Illustrator to map out the locations of the lines. I will be honest… I did not expect this to be so difficult. I used if statements to confine lines and move them around, so everything is “animated”.

Above, is the sketch I attempted to recreate on p5js.
As you can see… it didn’t turn out as expected.

sketch

/*
Daniel Noh
Section D
dnoh@andrew.cmu.edu
Project-04-String-Art
*/

var x1 = 172;
var y1 = 300;
var x2 = -50;
var y2 = 0;

var x3 = 100;
var y3 = 92;
var x4 = 0;
var y4 = -30;

var x5 = 95;
var y5 = 300;
var x6 = 300;
var y6 = 0;

var x7 = 172;
var y7 = 62;
var x8 = 260;
var y8 = 0;

var x9 = 130;
var y9 = 250;
var x10 = 160;
var y10 = 200;

var x11 = 251;
var y11 = 237;
var x12 = 229;
var y12 = 160;

var x13 = 268;
var y13 = 213;
var x14 = 190;
var y14 = 145;

var x15 = 182;
var y15 = 276;
var x16 = 218;
var y16 = 235;

function setup() {
    createCanvas(400, 300);
    background(255);
}

function draw() {
//red left ear

  stroke(255,0,0);
  strokeWeight(2);
  line(x1,y1,x2,y2);

  if (x1 > -150) {
    x1 = x1 - 50;
  }

  if (x2 < 240) {
    x2 = x2 + 50;
  }

  if (y1 > 180) {
    y1 = y1 - 20;
  }

  //blue left ear

  stroke(0,0,255);
  line(x3,y3,x4,y4);

  if (x3 >= 100 & x3 <= 129) {
    x3 += 15;
    y3 -= 10;
  }
  if (y4 <= 30 & y4 <= 100) {
    x4 -= 50;
    y4 += 50;
  }

  //blue right ear

  stroke(0,0,255);
  line(x5,y5,x6,y6);

  if (x5 >= 95 & x5 <= 400) {
    x5 = x5 + 55;
  }
  if (x6 <= 300 & x6 >= 130) {
    x6 = x6 / 1.04;
  }
  if (x5 > 400) {
    y5 = y5 - 100;
  }

  //red right ear
  stroke(255,0,0);
  line(x7,y7,x8,y8);

  if (x7 <= 205) {
    x7 = x7 + 17;
    y7 = y7 - 3;
  }
  if (x8 >= 210) {
    x8 = x8 - 26;
  }

  //left eye
  stroke(0);
  line(x9,y9,x10,y10);

  if (x9 <= 175) {
    x9 = x9 + 5;
    y9 = y9 + 1;
  }
  if (x10 >= 143) {
    x10 = x10 - 5;
    y10 = y10 - 9;
  }
  if (x10 >= 129 & x10 <= 142) {
    y10 = y10 + 13;
    x10 = x10 - 4;
  }

  //right eye top
  line(x11,y11,x12,y12);

  if (x11 <= 265) {
    x11 = x11 + 5;
    y11 = y11 - 5;
  }
  if (x12 >= 200) {
    x12 = x12 - 7;
    y12 = y12 - 5;
  }

  //right eye bottom
  line(x13,y13,x14,y14);

  if (x13 <= 278) {
    x13 = x13 + 3;
    y13 = y13 - 3;
  }
  if (x14 <= 215) {
    x14 = x14 + 4;
    y14 = y14 + 6;
  }

  //mouth
  line(x15,y15,x16,y16);

  if (x15 <= 205) {
    x15 = x15 * 1.03;
    y15 = y15 * 1.01;
  }
  if (x15 >= 206 & x15 <= 232) {
    x15 = x15 * 1.03;
    y15 = y15 / 1.02 ;
  }
  if (x16 >= 213) {
    x16 = x16 - 4;
    y16 = y16 - 5;
  }
  if (x16 >= 176 & x16 <= 212) {
    x16 = x16 / 1.03;
    y16 = y16 * 1.01;
  }
}

sijings-project04-stringArt

Sijings-StringArt

//Clair(sijing) Sun
//session C
//sijings@andrew.cmu.edu
//stringArt
var angle=0
function setup() {
    createCanvas(400, 300);
}

function draw() {
    
    //outer patel
    strokeWeight(1.5);
    background(247,234,186);


    //left top middle petal - 1st curve
    var curveinY = height/2+40;//local variable for determing the changes in location of lines
    var curveinX2 = width/2;

    for (var i5 = 0 ; i5 < 80 ; i5 ++) {
        stroke(250,112,154); 
        line(0, curveinY, curveinX2, 0);
        curveinY -= 10;//by minusing 10, we change the start position of y everytime a new line is created
        curveinX2 += 10;//by adding 10, we change the end position of x everytime a new line is created
    }
    

    //left bottom petal - 2nd curve
    var curve1Y = height/2+50;
    var curve1X2 = width/2+50;
    var color31=251;//an initial value for color changing
    var color32=171;
    var color33=126;
    var colorchange3=0;//the variable helps changing the color

    for (var i = 0 ; i < 50 ; i ++) {
        colorchange3+=3;//the value each time the RGB value changes
        stroke(color31,color32+colorchange3,color33+colorchange3); 
        line(0, curve1Y, curve1X2, height);
        curve1Y -= 10;//similar concept as the previous curve
        curve1X2 -= 10;
    }
    
    //petal at the top left, far back - 3rd curve
    var curve2X = 50;
    var curve2Y2 = height/2+50;
    var color21=250;//color for 3rd curve variables
    var color22=172;
    var color23=168;
    var colorchange2=0;//vairble helps chainging the color

    for (var i2 = 0 ; i2 < 50 ; i2 ++) {
        colorchange2+=4;//changed value everytime the RGE value changes
        stroke(color21,color22+colorchange2,color23+colorchange2); 
        line(curve2X, 0, 0, curve2Y2);
        curve2Y2 -= 10;//ending y position changed
        curve2X += 10;//starting x position changed
    }
    
    //patel at the top right -4th curve
    var curve3X = 50;
    var curve3Y2 = 50;
    var color1=255;
    var color2=185;
    var color3=205;
    var colorchange1=0;

    for (var i3 = 0 ; i3 < 50 ; i3 ++) {
        colorchange1+=2;
        stroke(color1,color2+colorchange1,color3); 
        line(curve3X, 0, width, curve3Y2);
        curve3X += 10;//starting x position changed
        curve3Y2 += 10;//ending y position changed
    }
    
    //petal at the bottom right - 5th curve
    var curve4Y = 50;
    var curve4X2 = width-50;
    var color11=255;
    var color12=65;
    var color13=101;
    var colorchange=0;

    for (var i4 = 0 ; i4 < 50 ; i4 ++) {
        colorchange+=5;//color gradient between lines 
        stroke(color11,color12+colorchange,color13); 
        line(width, curve4Y, curve4X2, height);
        curve4X2 -= 10;
        curve4Y += 10;
    }
    
    
    //top left petal, on the front - 6th curve
    var curvein2X = width/2;
    var curvein2Y2 = height/2;
    var color41=255;
    var color42=125;
    var color43=125;
    var colorchange4=0;

    for (var i6 = 0 ; i6 < 80 ; i6 ++) {
        colorchange4+=3;
        stroke(color41,color42+colorchange4,color43); 
        line(curvein2X, 0, 0, curvein2Y2);
        curvein2X -= 10;
        curvein2Y2 += 10;
    }

    push();//to avoid changing color and stroke for other variables
    noStroke();
    fill(255,255,255);
    ellipse(width/2,height/2-20,135,135);
    pop();

    //middle spinning flower
    if (mouseX>110&mouseX<270&&mouseY>90&&mouseY<200){
        //when mouse approaches the middle, circle appears
        for(var ii = 1; ii <=100; ii+=0.1) {//set to 100 so it will keep spinning
            angle+=30;//changing variable for spinning
            stroke(255, 114, 115);
            line((width/2-20)+computeX(3,angle), (height/2+20)+computeY(3,angle),
                width/2+computeX(70,angle+140), (height/2-20)+computeY(70,angle+140));
        //the inspiration came from deliverables
        }

    }
    

}

function computeX(r,angle) {//creating own function to cauculate the spinning circle
    return r*cos(angle);
}

function computeY(r,angle) {
    return r*sin(angle);
}


For this project, I had a really hard time to figure out what I really want to do because I personally don’t like string art which seems to be too scientific for me. However, after seeing the provided examples, I start to understand its beauty. I first analysed the Holly Hatfield’s blog on “7th Grade String Art” to figure out the algorithm. Once I understood how curves were created, my project became easier. My intention was to create a unique style of an eye where the spinning eyeball will appear once your mouse is on the pupil. After I finished creating the project, I felt my algorithm was too simple so I started figuring out how to make gradient curves (which is shown and explained in the comments). The whole process was fun and improved my understanding of this language.

nahyunk1-Project04-String Art

sketch

function setup() {
    createCanvas(400, 300);
    background("lavender");
}
function draw() {
    for (var i = 1; i < 300; i += 6) { // first set of chrome lines;
      strokeWeight(2);
      stroke(mouseX-1, mouseX-5, mouseY-10);
      line(i, 0, i*10, 500);
    }
    for (y = 10; y < 300; y += 10) { //the yellow lines;
      stroke(255,250,205);
      strokeWeight(1.2);
      line(-i, y/400 + 30, 400, y*2);
    }
    for (i =0; i < 40; i++) { // white beams and orange beams;
      stroke("white");
      strokeWeight(0.2);
      line(1, i*1.5, i+200, 400);
      stroke("orange");
      line(i+400, 300, i*1.5, i*3.5);
    }
    for (i = 10; i <300; i += 3) { // coral pink lines at the bottom;
      var y1 = i*(30/400);
      stroke("pink");
      strokeWeight(0.5);
      line(i, y1*9, 90, 400);
    }
    for (h =0; h < 100;h +=8) { // floating blue lines;
      stroke("skyblue");
      var y1 = 170;
      var y2 = 23;
      line(h+20, y1, h*5 ,y2);
      y2 += y2
    }
}

I basically played around with the codes to get a better understanding of how each of the equations affect the shape and size of each set of line drawings. I also used color to identify each set of strings to show more distinction from one another.

jiaxinw-sectionB-Project 4-String Art

sketch

function setup() {
    createCanvas(300, 400);
    background(20);

    //left white crossed lines
    stroke(255);
    var yl = height/4*3;
    var ym1 = height/8*5;

    for(var i=0; i < 15; i++){
        line(0, yl, width/2, ym1);
        yl *=0.97;
        ym1 *= 1.02+mouseX;
    };

    //right white crossed lines
    var yr = height/4*3;
    var ym2 = height/8*5;

    for(var i=0; i < 15; i++){
        line(width, yr, width/2, ym2);
        yr *=0.97;
        ym2 *= 1.02;
    };


    //left top lines 
    var x1 = 0;
    var y1 = height/2;

    for (var i=0; i < 15; i++){
        stroke(251,63,65);
        line(x1, 0, 0, y1);
        x1 += 15;
        y1 -= 10;
    };

    // right top lines 
    var x2 = width;
    var y2 = height/2

    for (var i=0; i < 15; i++){
        stroke(18,187,255);
        line(x2, 0, width, y2)
        x2 -= 15;
        y2 -= 10;
    };

    // right bottom lines
    var x3 = width;
    var y3 = height/2;

    for(var i=0; i < 15; i++){
        stroke(255, 242, 0);
        line(x3, height, width, y3)
        x3 -= 15;
        y3 += 10;
    };

    // left bottom lines
    var x4 = 0;
    var y4 = height/2;

    for(var i=0; i < 15; i++){
        stroke(0,255,217);
        line(x4, height, 0, y4);
        x4 += 15;
        y4 += 10;
    }

    //upper left grey crossed triangle
    var x5 = width/4;
    var y5 = height/2;

    stroke(100);
    line(x5, y5, width/2, y5)
    line(x5, y5, x5+(width/2-x5)/2, y5- sqrt(3)/2*(width/2-x5));
    
    for(var i=0; i < 8; i++){
        line(x5+5, y5, width/4+(width/2-x5)/2, y5- sqrt(3)/2*(width/2-x5));
        x5 += 10;
    }

    //upper purple triangle
    var x6 = width/4*3;
    var y6 = height/2;

    line(width/2, y6, x6, y6)
    line(x6, y6, width/4+(width/4)/2, y5- sqrt(3)/2*width/4);

    for(var i=0; i < 8; i++){
        line(x6-5, y6, width/4+(width/4)/2, y5- sqrt(3)/2*width/4);
        x6 -= 10;
    }

    //lower purple triangle
    var x7 = width/4;
    var y7 = height/2;

    stroke(156,0,255);

    for(var i=0; i < 31; i++){
        line (x7, y7, width/2, height/4*3);
        x7 += 5;
    }

    var x8 = width/4;
    var y8 = height/2;

    for(var i=0; i < 31; i++){
        line (x8, y8, width/2, height/4);
        x8 += 5;
    };

    
}

function draw() {
    
}


I tried to create a common usual string art pattern like this at first :

Later, I started to try to create a concrete shape in the middle of my canvas. During this project, I just had fun with combining different sequences of lines.

keuchuka-project4

project4

//Fon Euchukanonchai
//15-105 SECTION A
//keuchuka@andrew.cmu.edu
//Projedt-04


function setup () {
	createCanvas(400, 300);
	background(0);
}

function draw () {


	var w60 = width/60; //increment variable

	background(255);

	conMouseX = constrain(mouseX, 0, 310); //constrain mouse to desired point of stopping movement
	tlRatio = map(conMouseX, 0, width, 0, width/30); //remaps mouseX point for for loop


	for (var x = 0; x < 30; x ++){
		
		//pink lines

		stroke(255, 0 , 255);
		strokeWeight(1);
		//left half pink lines
		line(x*w60, height/2, width/2, x*tlRatio)
		//right half pink lines
		line(x*w60+width/2+5, height/2, width/2, x*tlRatio)
		

		//blue lines

		strokeWeight(1)
		stroke(0, 255, 255)

		//right half blue lines
		line((x*w60)+width/2, height/2, width/2, x*tlRatio)
		//left half blue lines
		line(x*w60, height/2, width/2, x*tlRatio+5)
		//most left blue lines
		line(x*width/60, 0, 0, height/2)

		//yellow lines
		stroke(255, 255, 0)

		//left half yellow lines
		line(x*w60+5, height/2, width/2, height-x*tlRatio)
		//most left yellow lines
		line(0, x*w60+height/2, width/2, height)
		
		//lighter pink lines
		stroke(255, 100, 255)

		//left half pink lines
		line(x*w60, height/2, width/2, height-x*tlRatio)
		
}


}


I wanted to experiment with how string art and particularly moving string art would affect color composition when they interact, as they come together and fall apart, mix and divide.