Brandonhyun- Project-07-Curves

sketch

//Brandon Hyun
//bhyun1@andrew.cmu.edu
// 15104 Section B
// Project 07

var k = 900/30;
var j = 60/80;


function setup() {
    createCanvas(440, 440);
    frameRate(100);
}

function draw() {
	background(0);
  translate(width/2, height/2);
	beginShape();

	stroke(30, 400, 21);
	fill(255);
	strokeWeight(0.5);

	for (var t = 0; t < TWO_PI * 8; t += 0.2){
		var r = map(mouseX, 0, (500 * cos(k * t)), mouseY, (200 * cos((k*j) * t)));
		var x = r * sin(t);
		var y = r * cos(t);
		vertex(x,y);
	}

	for (var s = 0; s < TWO_PI * 4; s += 0.01){
		var r2 = map(mouseX, 0, (40 * cos(k * s)), mouseY, (20 * cos((k*j) * s)));
		var x2 = r2 * sin(s);
		var y2 = r2 * cos(s);
		vertex(x2,y2);
	}

	endShape(CLOSE);
}

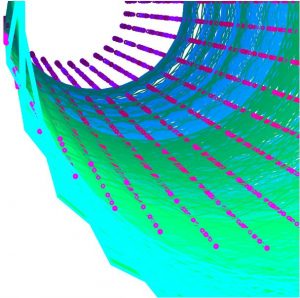
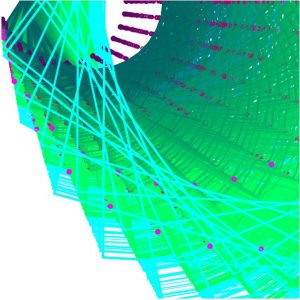
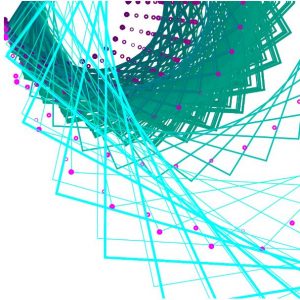
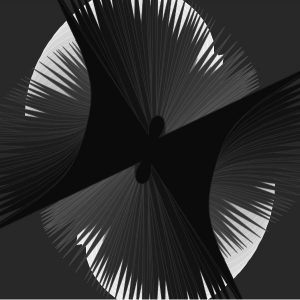
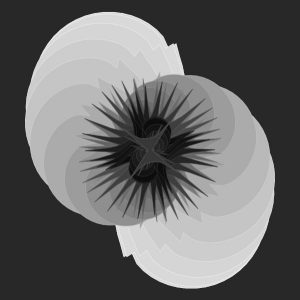
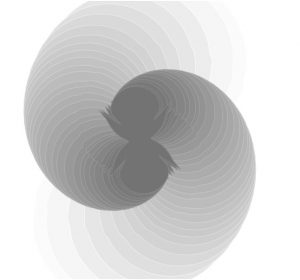
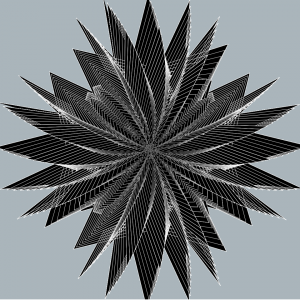
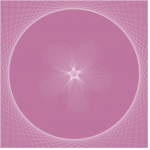
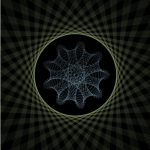
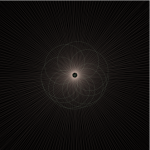
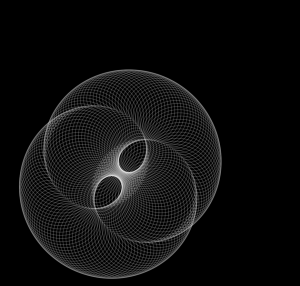
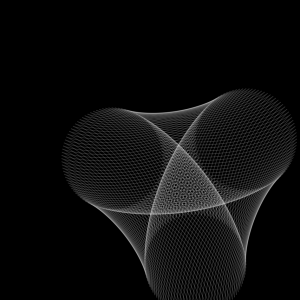
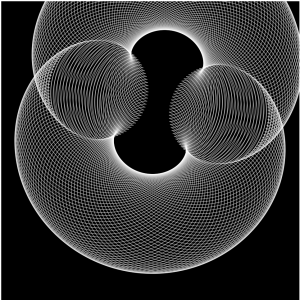
For this Project, I wanted to create a LaserBeam effect using different curvatures and effects. When I came up with this idea I knew that the color of the strokes that I am creating have to be light green and also very thin. So I decided to add these effects into my code and make sure that it represented that.

Since we had to create compositions with geometric shapes I wanted to see them inside the laser beams that I created. So as you move the mouse to mouseX and mouse Y, you can see that there are geometric shapes that exist in those light beams which are very dynamic.

It was difficult in the beginning, but did some research in the internet and also referred to some of Schiffman’s videos in Youtube and that helped me a lot with this assignment. It has been a while since I did mathematics and getting refreshers on sin, cos, and tan was somewhat exciting and new. I hope I can create different compositions with this method of using trigonometry and lines.

danakim-Project-07

sketch

//Dana Kim
//danakim@andrew.cmu.edu
//Section D
//Project-07

var nPoints = 30;

function setup() {
  createCanvas(480, 480);
}

function drawCurve() {
  var cx = constrain(mouseX, 100, 400);
  var cy = constrain(mouseY, 100, 400);

  noFill();
  beginShape();
  for(var i = 0; i < nPoints; i++){
    strokeWeight(random(.5,3.5));
    var t = (i/1.5)*500; //determines the angle of the vertexes
    var a = (cx/.5); //determines the scale of curve
    var px = (1/cos(t)+(a*cos(t)))*cos(t);
    var py = (1/cos(t)+(a*cos(t)))*sin(t);
    stroke(cx, 0, cy);
    ellipse(px, py, 5, 5); //creates ellipses along points of curve
    stroke(0, cx, cy);
    vertex(px*1.5, py*1.5); //creates curves
  }
  endShape(CLOSE);
}

function draw() {
  drawCurve();
}

I used the Conchoid of de Sluze roulette curve for this project. I made two different, yet connected, objects within the drawing with this curve. One of the set of curves was written to be made of ellipses that are placed on points along the curve. The second set just draws the curves as they are. The scale and colors were set to change as the mouseX and mouseY changes.

rkondrup-project-07-Composition-with-Curves

sketch

// ryu kondrup
// rkondrup@andrew.cmu.edu
// section D
// project-07-Composition-with-Curves


// http://mathworld.wolfram.com/DevilsCurve.html
function setup() {
    createCanvas(480, 480);
    frameRate(20);
    //dark grey bg
    background(40);
    stroke(255);
    fill(40);
}

function draw() {
    //to move object to center and rotate
    push();
    translate(width / 2, height / 2);
    rotate(2*PI*mouseX/480)
    drawDevilsCurve();
    pop();
}

function drawDevilsCurve() {
        var bigRange = 100;
        var t = map(i, 0, bigRange, 0, 100);
        var b = map(mouseY, 100, height-100, 0, 50);
        var a = map(mouseX, 100, height-100, 0, 200);

//to draw actual devil's curve
    fill(40);
    beginShape();
    for (var i = 0; i < bigRange; i++) {
        var t = map(i, 0, bigRange, 0, 2*PI);
//x and y for parametric equation
        var x = cos(t)*sqrt((sq(a)*sq(sin(t))) - sq(b)*sq(cos(t))/(sq(sin(t))-sq(cos(t))));
        var y = sin(t)*sqrt((sq(a)*sq(sin(t))) - sq(b)*sq(cos(t))/(sq(sin(t))-sq(cos(t))));
        // change value with mouseposition
        fill(mouseX/2, mouseX/2, mouseX/2);
        // make outline slightly lighter than fill
        stroke(mouseX/2+20, mouseX/2+20, mouseX/2+20)
        //to draw each frame
        vertex(x, y);
    }
    endShape(CLOSE);

}

function mousePressed() {
    //to reset background on click
    background(40);
}

Before starting this project I assumed it would be relatively easy. Upon starting, however, I had an unexpectedly difficult time getting my code to display. After I finally did get it to display, it turned out that the curve I had chosen was not of the highest aesthetic quality, i.e. it looks like a chunky spider. Nevertheless, I decided to work with it, and ended up choosing a monochromatic color scheme as an experiment with changing gradients.

hyt-Project-07: Infinity Curve Composition

hyt-07-project

// helen tsui
// 15-104 section d
// hyt@andrew.cmu.edu
// project-07-composition-waves


function setup() {
    createCanvas(480, 480);
    background(44, 66, 81, 100);
}


function draw() {
    drawcochleoid();

}

function drawcochleoid() {
    // Eight Curve
    map(mouseX, 0, width, 0, 200);
    beginShape();
    //stroke(209, 104, 104); //red
    stroke(100 + mouseX / 2.5);
    strokeWeight(0.5);
    //fill(204 - i * 2, 46, 32);
    fill(0);
    //infinity
    translate(width / 2, height / 2);
    for(var i = 0; i < mouseX / 2; i += 0.5) {
        var a = 1.9 * i; 
        var t = 6 * i;
        var x1 = a * sin(t);
        var y1 = a * sin(t) * cos(t);
        var y2 = a * sin(t);
        var x2 = a * sin(t) * cos(t);
        vertex(x1, y1);
    }
    endShape();

    // vertical shape
    beginShape();
    for(var i = 0; i < mouseX / 2; i += 0.5) {
    var a = 0.9 * i; 
    var t = 12 * i;
    var y2 = a * sin(t);
    var x2 = a * sin(t) * cos(t);
    vertex(x2, y2);
    }
    endShape();
}


For this project, I browsed on the internet in search for parametric equations that could be embedded within the code, and after some search found the “infinite loop” sign that I was able to use. To create some dimensionality, I altered the color values in order to change the greyscale. Also, for the background part I happened to change values and created a similar “noise effect” as the background.

I also experimented with different proportions that led to different results, such as this one. If I had more time I wish to play with the details more to achieve a better landscape-like picture.

Nayeon-Project07-Curves

nayeonk1

//Na-yeon Kim
//15-104, B section
//nayeonk1@andrew.cmu.edu
//Project-07 (Composition with Curves)

//draw canvas
function setup() {
    createCanvas(480, 480);
}

//map the r, g, b color
function draw() {
    var r = map(mouseX, 0, width, 100, 255);
    var g = map(mouseY, 0, height, 0, 150);
    var b = map(mouseX, 0, width, 0, 255);
    noFill();
    background(0);

//Hypotrochoid changing color based on mouse cursor
    push();
    stroke(r, g, b, 50);
    strokeWeight(0.5);

    translate(width / 2, height / 2);
    drawHypotrochoid();
    pop();

//hypocycloid changing color based on mouse cursor
    push();
    stroke(b, r, g);
    strokeWeight(0.2);

    translate(width / 2, height / 2);
    drawHypocycloid();
    pop();
}

function drawHypotrochoid() {
//draw hypotrochoid
//http://mathworld.wolfram.com/Hypotrochoid.html
    var x;
    var y;
    var h = 400;
    var a = map(mouseX, 0, width, 0, 5);
    var b = map(mouseY, 0, height, 0, 1);
//x = (a - b) * cos t + h cos(((a - b) / b) * t)
//y = (a - b) * sin t - h sin(((a - b) / b) * t)
    beginShape();
      for(var i = 0; i < 500; i ++) {
        var angle = map(i, 0, 200, 0, 360);
        x = (a - b) * cos(angle) + h * cos(((a - b)) * angle);
        y = (a - b) * sin(angle) - h * sin(((a - b)) * angle);
        vertex(x, y);
      }
    endShape();
}

function drawHypocycloid() {
//draw hypocycloid
//http://mathworld.wolfram.com/Hypocycloid.html
    var x;
    var y;
    var a = map(mouseX / 2, 0, width, 0, 200);
    var b = map(mouseY / 2, 0, height, 0, 200);
//x = ((a - 1) * cos t) + ((a - 1) * cos t)
//y = ((a - 1) * sin t) - ((a - 1) * sin t)
    beginShape();
    for (var i = 0; i < 300; i ++) {
      var angle = map(i, 0, 100, 0, 6);
      x = ((a - 1) * cos(angle / 2)) + ((a - 1) * cos(angle * b));
      y = ((a - 1) * sin(angle / 2)) - ((a - 1) * sin(angle * b));
      vertex(x, y);
    }
    endShape();
}

For this assignment, I looked through the Mathworld curves site first. And I realized that It’s been a while(I mean.. really….) to study any math so I need to start from very simple math stuff. I also got little help from some friends who are familiar with math to build a equation for this. After long time struggle, I finally managed to build a curves, and then I played it with fun! It was very hard to think about draw something with math, but after knowing the formula it was fun to play with numbers!
Here are some screenshot images from composition curves that I made.

NatalieKS-Project-07

This project was pretty difficult for me since I hadn’t worked with trig functions and parametric equations in over a year. Most of the time spent on this was just trying to figure out what the equations actually did when implemented in p5js, and understanding what i needed to change in order to get my desired result. I wanted to draw a little picture, and when I saw the ellipse evolute, it reminded me of the stars from Peter Pan. The star changes size and color as you move the mouse. I would’ve liked to try to create some kind of glow around the stars, and I tried using filter() and blur(), but both functions messed with the frame rate in a way that I didn’t know how to fix, so I abandoned the idea. I tried to reference this image, just because I liked the colors and shape. 

sketch2

//Natalie Schmidt
//nkschmid@andrew.cmu.edu
//Section D
//Project-07

//taken from examplde code
var nPoints = 100;
var R; //for color "r"
var G; //for color "g"
var B; //for color "b"

function setup() {
    createCanvas(300, 480);
    frameRate(20);
}

function draw() {
//draw the two stars
    background(22, 42, 67);
    push();
    translate(width - 70, height-400);
    drawLargeEllipseEvolute();
    pop();
    push();
    translate(width- 120, height - 350);
    drawLargeEllipseEvolute();
    pop();

    fill(255);
    textSize(24);
    text("Second star to the right", 25, 420);
    text("and straight on til morning!", 10, 450);
    //draw small random stars
    //modified code from
    //http://alpha.editor.p5js.org/nanou/sketches/rJ-EMpxa
    fill(255);
    var star = {x : 100, y : 50};
    star.x = random(0, width);
    star.y = random(0, height);
    ellipse(star.x, star.y, 4, 4);
    ellipse(star.x, star.y, 4, 4);
    //draw Peter Pan!
    drawPeter();
}

function drawLargeEllipseEvolute() {
//modified version of the example code
    var x;
    var y;
    var a = constrain(mouseX, 0, width);
    //map the value so it only expands a little
    var a1 = map(a, 0, 300, 0, 15);
    var b = constrain(mouseY, 0, height);
    //map the value so it expands only a little
    var b1 = map(b, 0, 300, 0, 15);
    //change colors with mouse
    R = map(mouseX, 0, width, 138, 255);
    G = map(mouseX, 0, width, 153, 255);
    B = map(mouseX, 0, width, 196, 255);

    fill(R, G, B);
    stroke(61, 80, 112);
    beginShape();
    for (var i = 0; i < nPoints; i++) {
        var t = map(i, 0, nPoints, 0, TWO_PI);

        x = ((sq(a1) - sq(b1))/a1) * pow(cos(t), 3);
        y = ((sq(b1) - sq(a1))/b1) * pow(sin(t), 3);
        vertex(x, y);
    }
    endShape(CLOSE);
}

function drawPeter() {
//draw Peter Pan!
    fill(0);
    //head
    ellipse(125, 225, 20, 20);
    push();
    //body
    translate(113, 252);
    rotate(35);
    ellipse(0, 0, 20, 40);
    pop();
    //left leg
    push();
    translate(98, 270);
    rotate(35);
    ellipse(0, 0, 7, 25);
    pop();
    //right leg
    push();
    translate(110, 275);
    rotate(35);
    ellipse(0, 0, 7, 25);
    pop();
    //left foot
    ellipse(91, 278, 8, 8);
    //right foot
    ellipse(107, 286, 8, 8);
    //left arm
    push();
    translate(102, 236);
    rotate(90);
    ellipse(0, 0, 8, 25);
    pop();
    //right arm
    push();
    translate(130, 250);
    rotate(90);
    ellipse(0, 0, 8, 25);
    pop();
    //peter pan hat!
    triangle(118, 216, 123, 196, 133, 221);
    //feather on hat
    stroke(4);
    line(120, 215, 115, 198);
}

hannahk2-Project-07

sketch

//Hannah Kim
//Section A
//hannahk2@andrew.cmu.edu
//Project-07

var nPoints = 100;
var EPITROCHOID = 0; // Cartesian Parametric Form  [x=f(t), y=g(t)]
var CRANIOID = 1; // Polar explicit form   [r =f(t)]
var curveMode = EPITROCHOID;

var numObjects = 10;
var centerX;
var centerY;
var angle = 0;
var distance = 100;

function setup() {
// creates canvas
createCanvas(500, 500);
centerX = width/2;
centerY = height/2;
noStroke();
ellipseMode(CENTER);
}

function draw() {
background(0, 0, 0, 20);
// draw the frame
fill(0); 
stroke(255, 0, 0, 40);
noFill(); 
rect(0, 0, width-1, height-1); 

// draw the curve and rotate at different angles
push();
translate(width / 2, height / 2);
drawecurve();
rotate(PI/3.0);
drawecurve();
rotate(2*PI /3.0);
drawecurve();
pop();

//function to draw the curve
function drawecurve() {
    var x;
    var y;
  
    var a = 70.0;
    var b = a / 2.0;
    var h = constrain(mouseY / 20.0, 0, b);
    var ph = mouseX / 80.0;
    
    beginShape();
    for (var i = 0; i < nPoints; i++) {
        var t = map(i, 0, nPoints, 0, TWO_PI);
        
        x = (a + b) * cos(t) - h * cos(ph + t * (a + b) / b);
        y = (a + b) * sin(t) - h * sin(ph + t * (a + b) / b);
        vertex(x, y);
    }
    endShape(CLOSE);
}

var angleObject = 360/numObjects;
	//creates for loop which creates ellipses
	for (var i=0;i<numObjects ;i++) {
	angle = frameCount;
	//makes the distance between the ellipses change according to mouseX
	distance = sin(radians(mouseX))*150;
	var posX = centerX + distance *cos( radians(angleObject*i + angle) );
	var posY = centerY + distance *sin( radians(angleObject*i + angle) );
		//creates different curves and lines
		//makes one curve grow in width depending on mouseY
		//changes size of curves based on var posX and posY
		fill(255, 0, 0, 0);
		ellipse(posX, posY, 10, 10);
		stroke(255, 0, 0, 40);
		strokeWeight(1);
		line(centerX, centerY, posX, posY);
		line(centerX, centerY, posX-100, posY-100);
		line(centerX, centerY, posX+100, posY+100);
	 	//ellipse(posX, posY, mouseY, 100);
		ellipse(posX, posY, 200, 200);
	}
}

I really enjoyed making this project and playing with the different parameters of the curves. I tried to make something resembling a rotating planet/orb.

keuchuka – project – 07

project7

//Fon Euchukanonchai
//15-104 Section A
//keuchuka@andrew.cmu.edu
//Project-07

var nP = 100;

var colorR;
var colorG;
var colorB;

var add = 0;
var plus = 0
var value = 0;


function setup() {
    createCanvas(400, 400);

}


function draw() {
	
	//random color values for background
	var rColor1 = random(150, 255)
	var rColor2= random(200, 255)

	// mapping colors to mouseX for the three blobs and blobs that radiate
   	var mC = map(mouseX, 0, 400, 0, 300)

   	var bOne = map(mC, 0, 400, 80, 90) 
	var bTwo = map(mC, 0, 400, 45, 48)
	var bThree = map(mC, 0, 400, 90, 100)

	var bBehind = map(mC, 0, 200, 0, 100)

	//setting background to random colors
    background(255, rColor1, rColor2, mouseX/50);
    
    // blobs that radiate
	Curve(bBehind, 0+value, 255, 0+value, 255, 10+add, 0, 0, 300, mouseY/130);
	Curve(bBehind, 255, 255,0+value, 255, 10+add, 0, 150, 0, mouseY/170);
	Curve(bBehind, 0+value, 255, 255, 255, 10+add, 0, 400, 250, mouseY/150);

	//blobs 
	Curve(bOne, 255-value, 255, 255-value, 255, 100-plus, 0, 0, 300, mouseY/140);
	Curve(bTwo, 255, 255, 255-value, 255, 100-plus, 0, 150, 0, mouseY/170);
	Curve(bThree, 255-value, 255, 255, 255, 100-plus, 0, 400, 250, mouseY/150);

	//if mouse is pressed, the whites and colors are flipped
	if (mouseIsPressed){
		plus = 70;
		value = 255
		add = 10

		} else {
		plus = 0 
		value = 0 
		add=0
	}


}


//function to build blob

function Curve(a, colorR, colorG, colorB, Scolor, trans, sW, mX, mY, ph) {

    var x;
    var y;
    
    // setting variables to change size, blob shape, and rotation
    var b = a / 2.0;
    var k = constrain(mouseX, 0, 400)
    var h = map(k, 0, width, 0, b-10);

    strokeWeight(sW);
    stroke(Scolor);

    //colors are parametric
    fill(colorR, colorG, colorB, trans);
    
    // blobs are variable in size, blob shape, rotation, and location
    beginShape();
    for (var i = 0; i < nP; i++) {
        var t = map(i, 0, nP, 0, TWO_PI);
        
        x = (a + b) * cos(t) - h * cos(ph + t * (a + b) / b);
        y = (a + b) * sin(t) - h * sin(ph + t * (a + b) / b);
        vertex(mX+ x,  mY+ y);
    }
    endShape();   
}

With this project, I wanted to create “blobs” that move in subtle ways. The example that looked like some bacteria inspired this sort of movement, therefore I decided to go with polar curve for my project. I realize that the few parameters I could work with were rotation, size, color, location, and the small changes of the shape. I have the mouse react to some of these parameters so they look like they are changing but in a very subtle, bacteria like way. These blobs also had potential coming together, so I had them change in size to look like they “radiate” color to mix and become a gradient. The last layer was to have the colors flip when the mouse is clicked, but otherwise it works the exact same way. The two states I captured were the colors, as I think this is the main change, most obvious change. But the change of the curve is what gives the sensibility to the whole project.

Jonathan Perez Project 7

sketch

//Jonathan Perez
//Section B
//jdperez@andrew.cmu.edu
//Project 7

var a = 100 // inner asteroid diagonal radius
var b = 100 // second inner asteroid diagonal radius
var a2 = 200 //outer astroid diagonal radius
var b2 = 200 //second outer astroid diagonal radius
var lineArrayX = [a, a, a, a, a, a, a, a, a, a, a, a, a, a, a, a, a]
var lineArrayY = [0, 0, 0, 0, 0, 0, 0, 0, 0, 0, 0, 0, 0, 0, 0, 0, 0]
var lineLength = 30
var lineSize = 5
function setup() {
    createCanvas(480, 480);
    background(255);
}

function draw() {
    background(255);
    mouseDistX = dist(mouseX, height/2, width/2, height/2); //X distance from center
    mouseDistY = dist(width/2, mouseY, width/2, height/2); //Y distance from center
    a = map(mouseDistX, 0, 240, 0, 150) //maps X distance from center to max a value
    b = map(mouseDistY, 0, 240, 0, 150); //maps Y distance from center to max b value
    a2 = map(mouseDistX, 0, 240, 0, 300); //maps X distance from center to max a2 value
    b2 = map(mouseDistY, 0, 240, 0, 300); //maps Y distance from center to max b2 value
    traceAstroid(height/2, width/2, a, b);
    drawAstroid(height/2, width/2, a2, b2);
}


//drawing line asteroid
function traceAstroid(x, y, a, b) {
    asteroidX =  a * pow(cos(millis()/1000), 3);// x parametric for an astroid x = acos^3(t)
    asteroidY =  b * pow(sin(millis()/1000), 3);// y parametric for an asteroid y = asin^3(t)
    push();
    translate(x, y);
    for(i = 0; i < lineArrayX.length; i++) {
        fill(255 - i*255/lineArrayX.length); //fades line into background
        noStroke();
        if(i < lineArrayX.length - 1){ //if not the leading point
            //trails behind the leading point
            lineArrayX[i] = lineArrayX[i+1] 
            lineArrayY[i] = lineArrayY[i+1]
        } else { //if the leading point
             //next X and Y coordinates
            lineArrayX[i] = asteroidX
            lineArrayY[i] = asteroidY
        }
        ellipse(lineArrayX[i], lineArrayY[i], lineSize, lineSize);
        ellipse(-lineArrayX[i], -lineArrayY[i], lineSize, lineSize);
    }
    pop();
}


//outer asteroid
function drawAstroid(x, y, a2, b2) {
    push();
    translate(width/2, height/2);
    rotate(TWO_PI/8); //eighth rotation so that inner astroid touches the inside walls
    for(i = 0; i < 472; i++) { // 472 stops the astroid exactly halfway down the vertical sides
        asteroidX2 = a2 * pow(cos(i/200), 3); // x parametric for an astroid x = acos^3(t)
        asteroidY2 = b2 * pow(sin(i/200), 3); // y parametric for an asteroid y = asin^3(t)
        fill(0);
        noStroke();
        ellipse(asteroidX2, asteroidY2, lineSize, lineSize);
        ellipse(-asteroidX2, -asteroidY2, lineSize, lineSize);
    
    }
    pop();
}

I thought this project was super fun… I haven’t had the chance to do any sort of geometry or math in a while, and this was a nice way to sort of flex those old muscles.

To start off, I just clicked around on the geometry site provided for us. I was just looking for a curve that both looked feasible to implement (with out smoke coming out of my ears) and aesthetically interesting. Eventually I stumbled across the astroid, and decided, sure, let’s use that.

After that, I just started playing around with how I could draw the shape and modify it. I knew right off the bat that I wanted to do something with a trailing point… so that was actually the first part I coded. After that I added the second rotated astroid (to make the whole image an astroid evolute).

On their own, these shapes aren’t super exciting. Originally, since the astroid is a hypocycloid, I was going to play around with the number of points in the curve (instead of just four points). Instead, I went a rotation direction instead. Well, I say rotation, but nothing is truly rotating in the image. In the code, the distance between diagonal points is being altered, to create the illusion of rotation. I thought that was pretty cool, especially with the trailing point moving around. To me this animation feels like a card turning around on one point.

Ziningy1-Section C- Project 07 Curves

In this project, I chose the Astriod and Deltoid curve equations. I was originally trying to combine the two curves, yet I found it visually too clustered. So I made it alternating when mouse is pressed. Basically, the mouse movement will determine the the rotation speed, the size and form of the curves. I also modified the transparency so that the curves will be brighter when it is bigger in shapes and darker when is smaller, which I intended to create a sense of perspective in the space.

sketch

//Zining Ye 
//15104 lecture 1 recitation C
//ziningy1@andrew.cmu.edu 
//Project-07

var t=1; 
var state; //set state for changes when mouse pressed 

function setup() {
    createCanvas(480, 480) 

    state = 1; //start with state 1 
    
}

function draw() {
    background (0);
    var offset=0; 

    translate(width/2, height/2-offset); //move curve to center 
    angleMode(DEGREES);

    t+=1+(mouseX+mouseY)/40;  //change rotation speed according to mouse position
    rotate(t); //rotate around center 
    pattern(); // call pattern function and draw the shape
   
   
}


function hypocycloid(){
    var a= 30; 
    var points=500; 


    var n = map(mouseX,0,width,70,150); //map the changing ranges  
    

    noFill();
    stroke(255,255,255,(mouseX+mouseY)/8); // change opacity with mouse movement 

    beginShape();
    
    for (var i=0; i<points; i++){

        //map angle changing range to 0-360 degree
        var t=map(i, 0, points, 0, 359);

        //curve equation 
        var x=1/3*n*(2*cos(t)+cos(2*t));
        var y=1/3*n*(2*sin(t)-sin(2*t));


        vertex(x,y);
    }

    endShape(CLOSE); 
}

function astroid(){

    var points=500; 

    var a=map(mouseX,0,width,5,40); //map the size change range 


    noFill();
    stroke(255,255,255,(mouseX+mouseY)/8); //change opacity with mouse movement 


    beginShape();
    for (var i=0; i<points; i++){

        //map angle changing range to 0-360 degree 
        var t=map(i, 0, points, 0, 359);
        
        //curve equation 
        var x=3*a*cos(t)-a*cos(3*t);
        var y=3*a*sin(t)-a*sin(3*t)

    
        vertex(x,y);

    }
    endShape(CLOSE);
}


function pattern(){


    for(var i=0; i<100; i++){ 
        
        //set x,y position that it goes in draw the shapes in a circle
        var x=5*cos(3.6*i);
        var y=5*sin(3.6*i);

        translate(x,y) //change postiion to draw shapes 


        //determine which curve to present 
        if (state == 1){
            hypocycloid();
        } else {
          astroid();  
        }
    }
}


function mousePressed(){

    //when mouse pressed, the state changes, so the curve chaneges. 
    if (state == 1){
    state = 2;
    } else {
        state = 1;
    }
}