![[OLD FALL 2017] 15-104 • Introduction to Computing for Creative Practice](https://courses.ideate.cmu.edu/15-104/f2017/wp-content/uploads/2020/08/stop-banner.png)
//Alvin Luk
//Section A
//akluk@andrew.cmu.edu
//Project-07
var nPoints = 200;
var edges = 2;
function setup() {
createCanvas(400, 400);
frameRate(10);
}
function draw() {
background(255);
// draw the frame
fill(0);
noStroke();
stroke(0);
noFill();
rect(0, 0, width-1, height-1);
// draw the curve
push();
translate(width / 2, height / 2);
drawCurve(edges);
pop();
}
//--------------------------------------------------
function drawCurve() {
// Hypotrochoid
// http://mathworld.wolfram.com/Hypotrochoid.html
// draws multiple hypotrochoid with differeing h's
for (var j = 0; j < 30; j++){
var x;
var y;
var a = map(mouseX,0,width,0,200);
var b = a/edges;
var h = map(mouseY,0,height,0,4*j);
//changes color gradient depending on which hypotrochoid currently at
//and also the position of mouseX and mouseY
var red = map(j,0,30,0,255);
var green = map(mouseX,0,width,0,255);
var blue = map(mouseY,0,height,0,255);
stroke(color(red,green,blue));
//draws single hypotrochoid
noFill();
beginShape();
for (var i = 0; i < nPoints; i++) {
var t = map(i, 0, nPoints, 0, TWO_PI);
x = (a - b) * cos(t) + h* cos(t * (a - b) / b);
y = (a - b) * sin(t) - h * sin(t * (a - b) / b);
vertex(x, y);
}
endShape(CLOSE);
}
}
//adds number of edges/ corners each time the mouse is pressed
function mousePressed() {
edges +=1
if (edges > 7){
edges = 2;
}
}
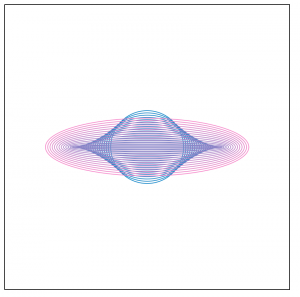
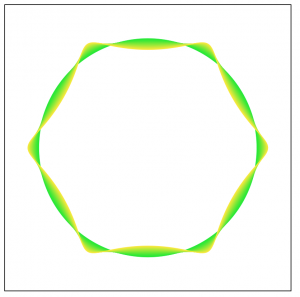
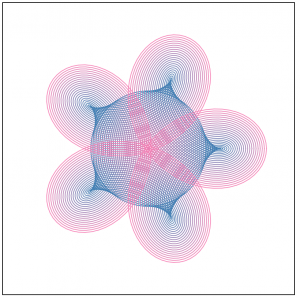
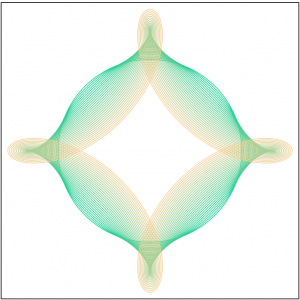
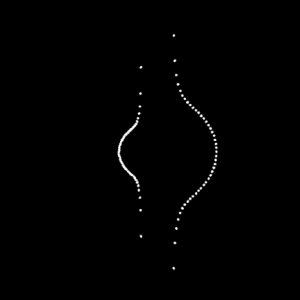
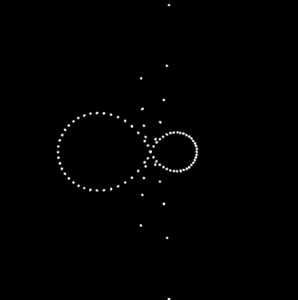
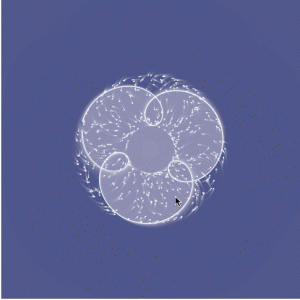
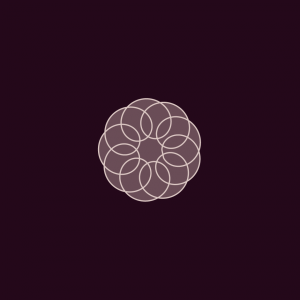
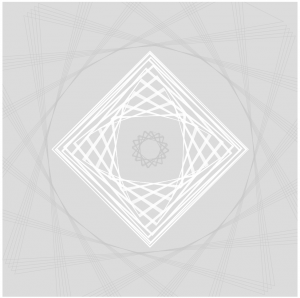
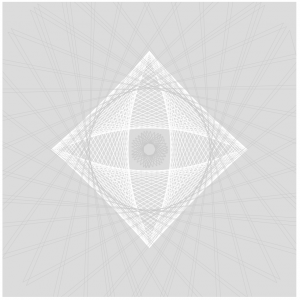
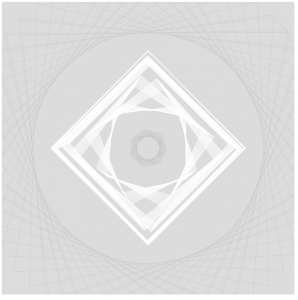
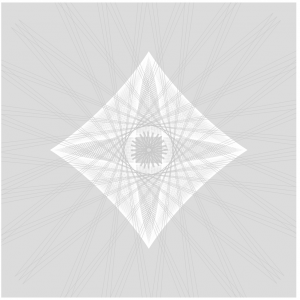
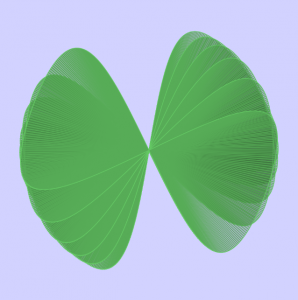
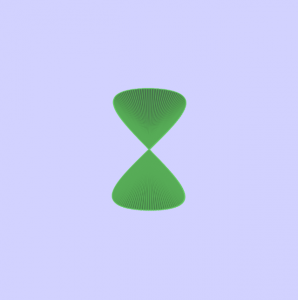
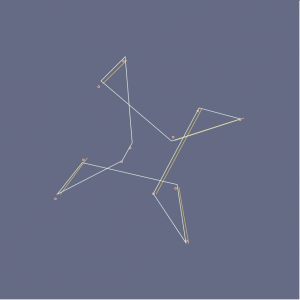
//--------------------------------------------------For this project. I first followed the guidelines provided in the assignments and chose a graph from the mathworks curves section. I chose the Hypotrochoid, since there was a lot of variables in the parametric equations of the curves that I could play with that enabled me to create varying versions and variations of the curve. I also thought that just one hypotrochoid seems kind of static. So I decided to use a for loop to generate numerous hypotrochoid super imposed on each other with a changed parameters. I also made it so the color changes based on the position of x and y. Clicking also changes the ratio of a and b creating new different classes of hypotrochoid. Below are some screenshots of what my program creates.