![[OLD FALL 2018] 15-104 • Introduction to Computing for Creative Practice](https://courses.ideate.cmu.edu/15-104/f2018/wp-content/uploads/2020/08/stop-banner.png)
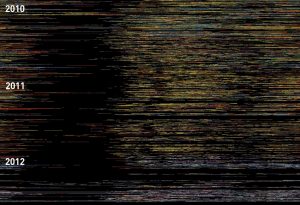
Marcin Ignac completes a lot of projects that focus on data visualization. Whether that’s data from an Internet of Things, from the stock market, or even from his dad’s workouts, Ignac finds a creative way to model the data. In “Every Day of My Life,” Ignac used an app called Tapper to track his foremost running app at all times of the day, every day, for two and a half years. He then visualized the data using Plask, separating each program into a specific color and each day into a band. The project should be consumed from top to bottom.
What I admire most about Ignac’s work, and specifically what I admire about this project, is that the work is something I would consider art at the end, but does not come from that. The usage of different programs is not meant to be artistic, and yet, Ignac takes it and makes art. In addition, the art holds onto the meaning – if I were to look at dark spots, I could probably guess where the holiday season slowed his work. This algorithm was probably pretty simple, assigning colors and arranging them chronologically. This simple yet meaningful project embodies Ignac’s style of grounding his work in the very real world of data.