![[OLD FALL 2018] 15-104 • Introduction to Computing for Creative Practice](https://courses.ideate.cmu.edu/15-104/f2018/wp-content/uploads/2020/08/stop-banner.png)
screenshot of the web page
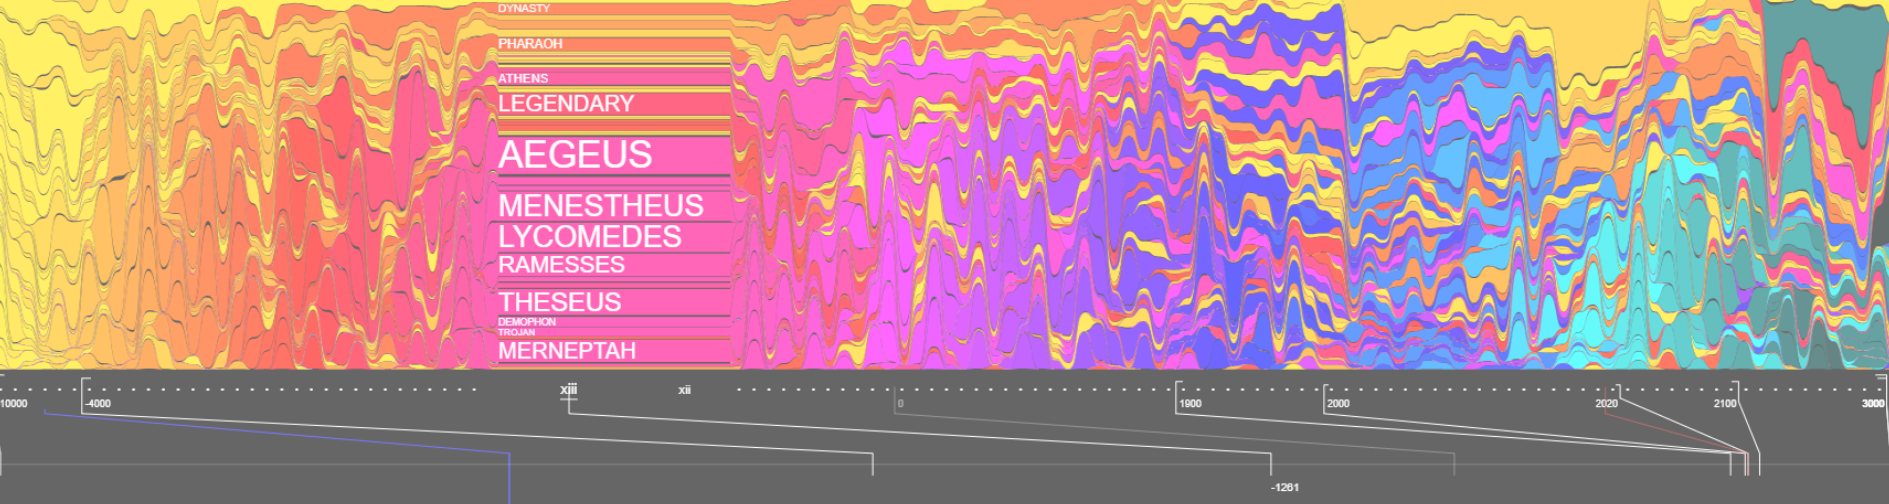
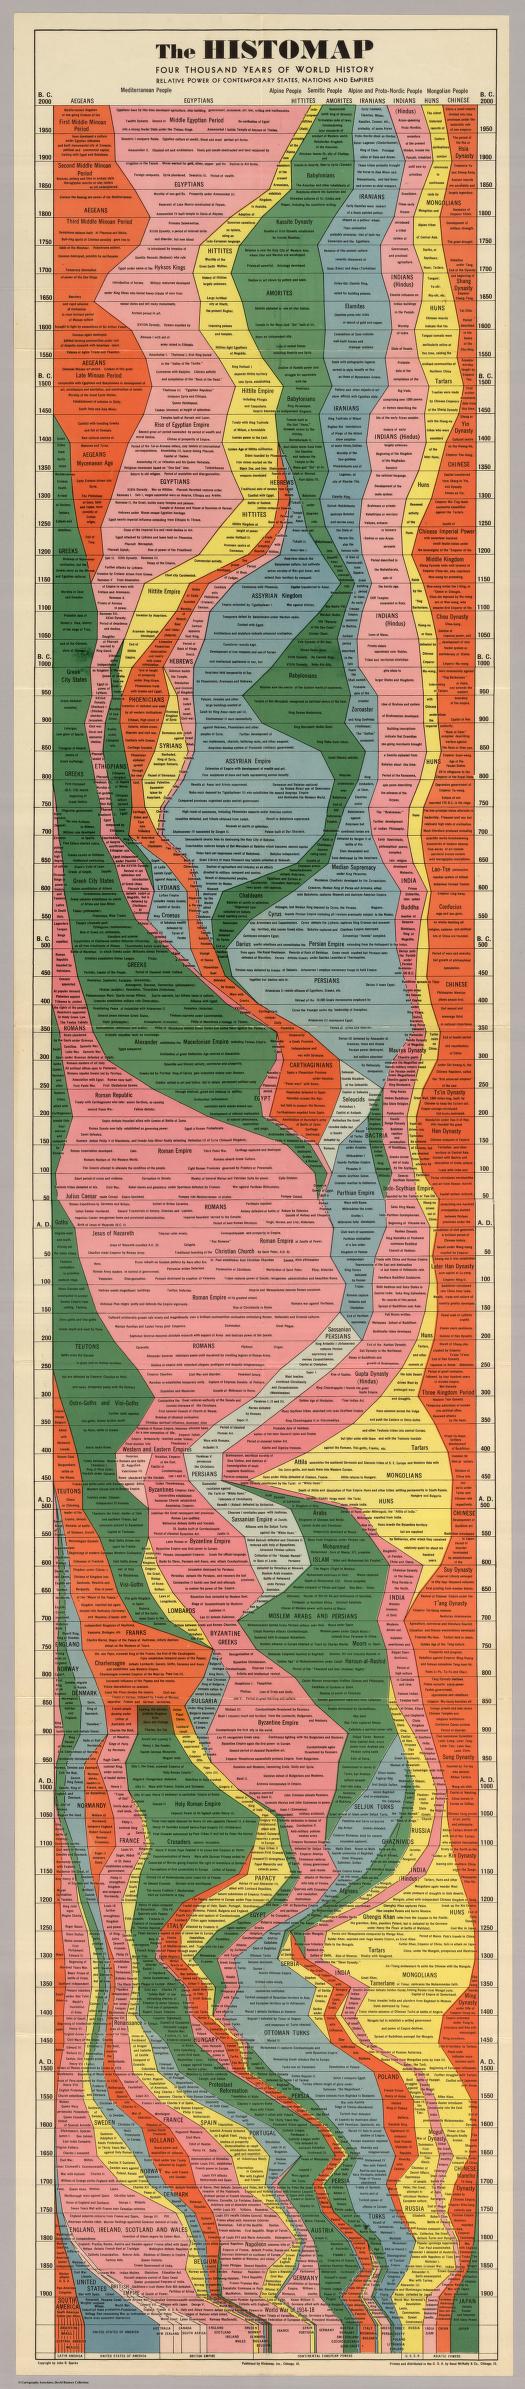
This is an exercice on representation done by Santiago Ortiz, remiscent of the Histomap, which is a visualization of 4000 years of History, created in 1931 by John B. Sparks.
Timeline of chronoligcal articles from Wikipedia: millenia (10 000 BC – 5 000 BC), centuries (40th BC – XIX), decades (1990s – 1990s), years (2000 – 2019), decades (2020s – 2090s) and centuries (22nd – 30th).
On this website histomap revisited, you could view the map zoomed in and click on the map, it would direct you to the wikipage.
This viedo is santiago ortiz talking about different ways to represent time.
What I admire of this project is all the theories behind to make data visulized especially focusing on the theme of time. It’s interesting to see the history not only in a linear way but you can ‘map’ it.