![[OLD FALL 2018] 15-104 • Introduction to Computing for Creative Practice](https://courses.ideate.cmu.edu/15-104/f2018/wp-content/uploads/2020/08/stop-banner.png)
sketch
//Sarah Yae
//smyae@andrew.cmu.edu
//Section B
//Project 7
var nPoints = 500;
var sizeHeart = 150;
function setup() {
createCanvas(400, 400);
}
function draw() {
background(220);
drawHeartCurve();
}
function drawHeartCurve() {
var t; //Theta
var x;
var y;
// Conditional to determine color of curve
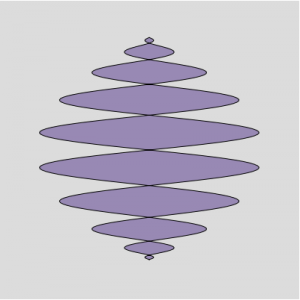
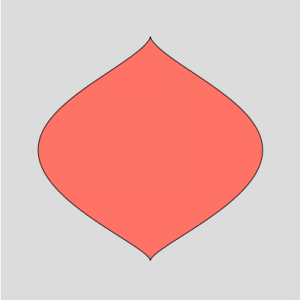
if (mouseX > width / 2) {
fill ('Salmon');
}
else {
fill (148,141,179);
}
// Draw the curve
// Heart formula used:
// x = 16 * sin^3(t)
// y = 13 * cos(t) - 5 * cos(2 * t) - 2 * cos(3 * t) - cos(4 * t)
beginShape();
for (var i = 0; i < nPoints; i++) {
// Conversion of "i" into radians
var t = map(i, 0, nPoints, 0, TWO_PI);
// Moving the mouse horizontally controls how many curves are drawn
var x = (width / 2) + sizeHeart * sin(t * mouseX / 20) * sin(t) * sin(t);
// Moving the mouse vertically controls how squiggly the lines get
var y = (height / 2) + sizeHeart * (cos(t)) - (cos(2 * t)) - (cos(3 * t * mouseY / 10)) - (cos(4 * t));
vertex (x,y);
}
endShape(CLOSE);
}I originally intended to create a heart, so I started by using a heart equation, which is commented in my code above. However, along the way, I figured out ways to make the curves more interactive, and more fun, than just a regular heart. I also wanted to play with different colors, so I used a conditional to call different colors depending on the condition of mouseX. It would have been great though, if the colors could have gradually changed from lavender to salmon, instead of having a sudden change. In addition, I had trouble fully understanding the math equation part, but I was still able to understand functions used to create the curve.