![[OLD FALL 2018] 15-104 • Introduction to Computing for Creative Practice](https://courses.ideate.cmu.edu/15-104/f2018/wp-content/uploads/2020/08/stop-banner.png)
var nPoints = 100;

function setup() {
    createCanvas(480, 480);

}

function draw() {
	background(60);

	//in this for loop, we draw the bakcground element of the randomized curve
    push();
	translate(width / 2, height / 2);
	for (r = 0; r < nPoints; r ++) {
		stroke(200);
		drawRandomDevil(r);
	}
	pop();

    //in this loop, we draw the primary forground element
    //which is the center devil's curve
	push();
	translate(width / 2, height / 2);
	rotate(mouseX / mouseY);
    for (v = 0; v < nPoints; v ++) {
    	stroke(mouseX - 200, v, mouseY - 300);
    	drawDevilBoi(v);
    }
	pop();

    //this loop is to create the six rotating deveil's vurves
    for ( c = 0; c < 6; c ++) {
    	push();
    	translate(width / 2, height / 2);
    	rotate(radians(60 * c));
	    translate(width / 4, height / 4);
	    rotate(mouseX / mouseY);
            for (v = 0; v < nPoints; v ++) {
    	    stroke(mouseX - 100, v, mouseY - 100);
    	    drawDevilBoi(v);
         }
	    pop();
    }
}


function drawDevilBoi (x) {
    //draw the devil's curve in this function
    //first declare all the variables
    var x;
    var y;

    var c = constrain((mouseX / width), 0, 1);
    var co = constrain((mouseY / height), 0.0, 1.0);

    var a = c * ((mouseX - 200) / 3 * (100 + v) / 100);
    var b = co * ((mouseY - 200) / 3 * (100 + v) / 100);

    //set desire stroke
    noFill();
    strokeWeight(0.25);
    //draw the curve
    beginShape();
    for (var i = 0; i < nPoints; i += 5) {
    	var t = map(i, 0, nPoints, 0, TWO_PI);
    	x = cos(t) * sqrt ((pow(a, 2) * pow(sin(t), 2) - pow(b, 2) * pow(cos(t), 2)) / (pow(sin(t), 2) - pow(cos(t), 2)));
    	y = sin(t) * sqrt ((pow(a, 2) * pow(sin(t), 2) - pow(b, 2) * pow(cos(t), 2)) / (pow(sin(t), 2) - pow(cos(t), 2)));
    	vertex(x, y + 10);
    }
    endShape(CLOSE);
}

function drawRandomDevil (x) {
	//draw another devil's curve, this time there is an element of randomness with it

	var x;
    var y;

    var c = constrain((mouseX / width), 0, 1);
    var co = constrain((mouseY / height), 0.0, 1.0);

    var a = c * ((mouseX - 200) / 3 * (100 + r) / 100);
    var b = co * ((mouseY - 200) / 3 * (100 + r) / 100);

    //set the desired stroke
    noFill();
    strokeWeight(0.075);
    //start to draw the curve
    //this curve will be in the background and looks like noise
    beginShape();
    for (var i = 0; i < nPoints; i += 7) {
    	var t = map(i, 0, nPoints, 0, random(radians(350, 360)));
    	x = cos(t) * sqrt ((pow(a, 2) * pow(sin(t), 2) - pow(b, 2) * pow(cos(t), 2)) / (pow(sin(t), 2) - pow(cos(t), 2)));
    	y = sin(t) * sqrt ((pow(a, 2) * pow(sin(t), 2) - pow(b, 2) * pow(cos(t), 2)) / (pow(sin(t), 2) - pow(cos(t), 2)));
    	vertex(x, y + 10);
    }
    endShape(CLOSE);
}
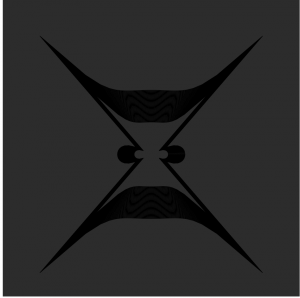
This project was a bit of a mixed bag for me, as I did struggle to implement the curve into my work at first and make it appear in a way that I wanted it to. (Also choosing the curve I wanted to pursue took me a while, but I ultimately settled on The Devil’s Curve because I thought that it’s shape was very unique and could produce some nice variation). However, once I figured that out and began to play around I really enjoyed myself. I never really knew what changing the variables would make my code look like, so it was an exciting process of trial and error to create a nice form.