![[OLD FALL 2018] 15-104 • Introduction to Computing for Creative Practice](https://courses.ideate.cmu.edu/15-104/f2018/wp-content/uploads/2020/08/stop-banner.png)
Information is often presented in a form of or with an appealing visual for the audience to be interested in the subject as well as grasping the palpable information more easily. Rachel Binx is an artist and a data scientist that has built Meshu, ManyMaps, Cliffs&Coasts, Monochōme, and Gifpop which are applications used to process data and make them into presentable visuals. A art piece by Binx that attracted my attention is Facebook Stories: Virality. She explains that it is a series of video clips that visualizes a single published content on Facebook being shared and being spread across hundreds of thousands of individuals on Facebook. She has captured the speed as well as the breadth at which the content travels to be spread across the Internet. A series of branches stem from a single person to represent the contents shared by her or him. As the branches grow, they are split to show the re-shares, sometimes creating a whole new generation of re-shares, sometimes showing a short-lived burst of activity. For the project, she worked with Zach Watson to build the WebGL framework that was used to generate the visualizations. I admire the creativity and the message that she conveys through the project, which can be perceived quite alarmingly as a content published thoughtlessly may go viral just in a second and reach unimaginably distant parts of the world.
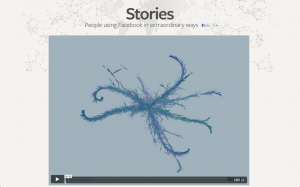
A screenshot from Rachel Binx’s Facebook Stories: Virality