![[OLD FALL 2018] 15-104 • Introduction to Computing for Creative Practice](https://courses.ideate.cmu.edu/15-104/f2018/wp-content/uploads/2020/08/stop-banner.png)
/* Miranda Luong
Section E
mluong@andrew.cmu.edu
Project-07
*/
var nPoints = 100;
function setup() {
createCanvas(400, 400);
frameRate(10);
}
function draw() {
background(255);
// draw the frame
fill(0);
noStroke();
stroke(0);
noFill();
rect(0, 0, width-1, height-1);
translate(width / 2, height / 2);
drawEpicycloidCurve();
}
//--------------------------------------------------
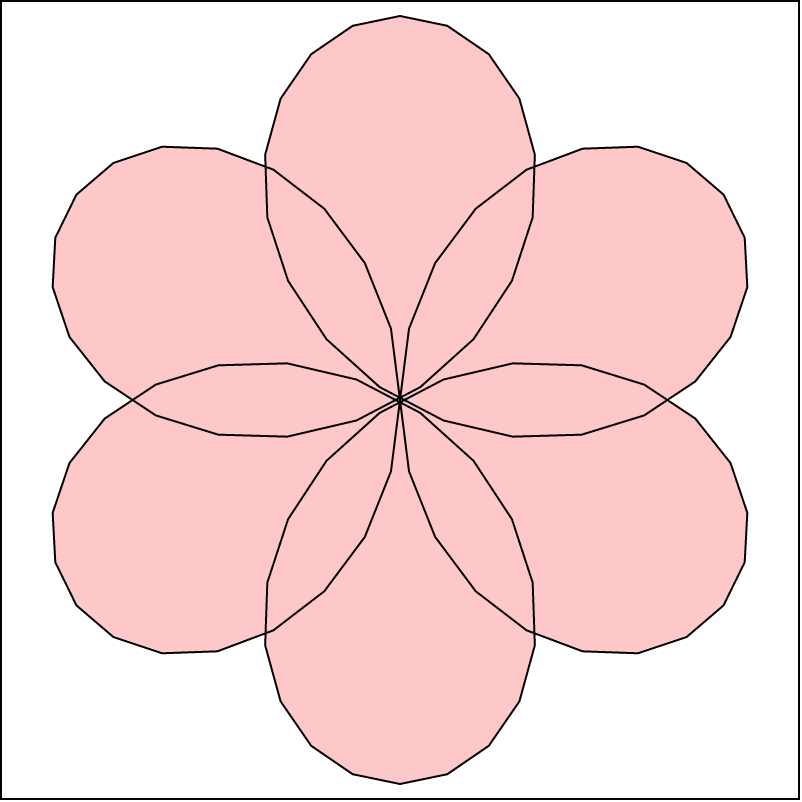
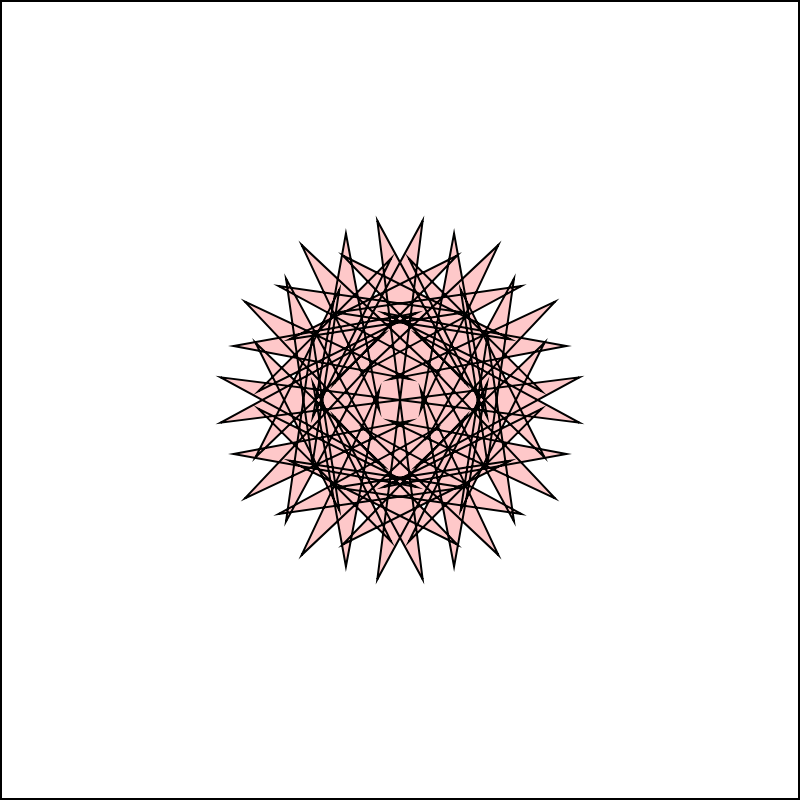
function drawEpicycloidCurve() {
// Epicycloid:
// http://mathworld.wolfram.com/Epicycloid.html
var x;
var y;
var a = 80.0;
var b = a / 2.0;
//Uses mouseX and mouse Y to define the number of petals and overall scale of curve
var n = round(dist(mouseX,mouseY,width/2,height/2)/5);
fill(255, 200, 200);
beginShape();
for (var i = 0; i < nPoints; i++) {
var t = map(i, 0, nPoints, 0, TWO_PI);
x = (n + 2) * (cos(t) - cos((n + 1) * t));
y = (n + 2) * (sin(t) - sin((n + 1) * t));
vertex(x, y);
}
endShape(CLOSE);
}
This was a really hard project to complete. It was hard translating the functions into code, seeing as I don’t really know much math anymore. It took lots of trial and error trying to navigate which variables controlled what in my function. I’m quite happy with the results though, I think it is a very pretty display.