/*
Veronica Wang
Section B
yiruiw@andrew.cmu.edu
Project 07
*/

var nPoints = 100;


function setup() {
    createCanvas(480, 480);
    frameRate(10);
}


function draw() {
    background(255);

    // draw the curves
    push();
    translate(width / 2, height / 2);
    drawEpitrochoidCurve();
    drawHypotrocoidCurve();
    pop();


}

//--------------------------------------------------
function drawEpitrochoidCurve() {
    // Epicycloid:
    // http://mathworld.wolfram.com/Epicycloid.html

    var x;
    var y;

    var a = 60.0;
    var b = a / 3.0;
    var h = constrain(mouseY / 2, 0, width / 5);
    var ph = mouseX / 50.0;

    noFill();
    stroke('red');
    strokeWeight(3);
    beginShape();
    for (var i = 0; i < nPoints; i++) {
        var t = map(i, 0, nPoints, 0, TWO_PI);

        x = (a + b) * cos(t) - h * cos(ph + t * (a + b) / b);
        y = (a + b) * sin(t) - h * sin(ph + t * (a + b) / b);
        vertex(x, y);
    }
    endShape(CLOSE);
}

function drawHypotrocoidCurve(){
    //Hypocycloid
    //http://mathworld.wolfram.com/Hypotrochoid.html
    var x;
    var y;

    var a1 = 200;
    var b1 = a1 / 3.0;
    var h1 = constrain(mouseY / 2, 0, width / 5);
    var ph1 = mouseX / 10.0;

    noFill();
    stroke('red');
    strokeWeight(3);

    beginShape();
    for (var i = 0; i < nPoints; i++) {
        var t = map(i, 0, nPoints, 0, TWO_PI);

        x = (a1 - b1) * cos(t) + h1 * cos((ph1 + (a1 - b1) / b1) * t);
        y = (a1 - b1) * sin(t) - h1 * sin((ph1 + (a1 - b1) / b1) * t);
        vertex(x, y);
    };
    endShape(CLOSE);
}
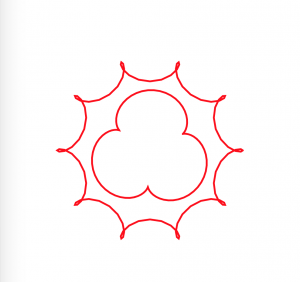
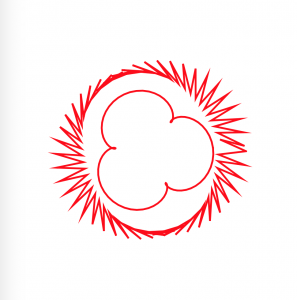
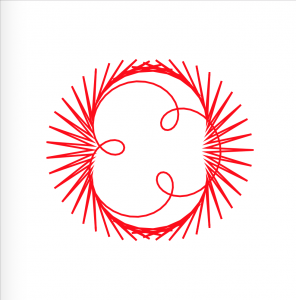
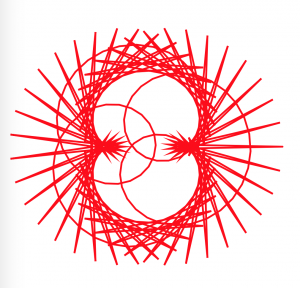
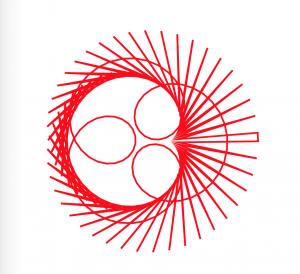
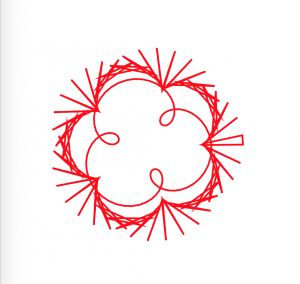
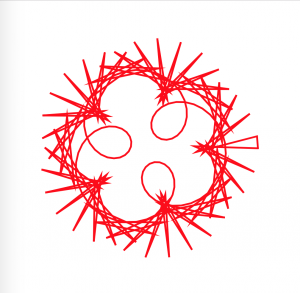
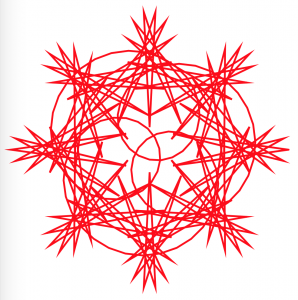
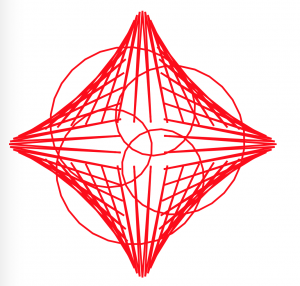
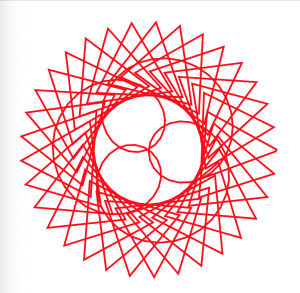
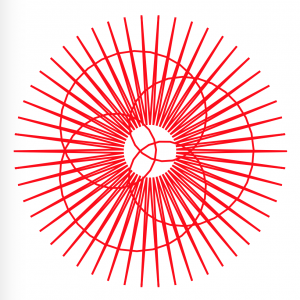
In this project, I used both the hypotrochoid and epitrochoid curves to create interesting compositions. I played around with the amplitude, divisions, diameters, etc of the curve functions. I think it’s interesting how sometimes the animation can sort of explain how the hypotrochoids were generated-when you can see a straight line rotating at the ‘beginning’ point.

![[OLD FALL 2018] 15-104 • Introduction to Computing for Creative Practice](https://courses.ideate.cmu.edu/15-104/f2018/wp-content/uploads/2020/08/stop-banner.png)