![[OLD FALL 2018] 15-104 • Introduction to Computing for Creative Practice](https://courses.ideate.cmu.edu/15-104/f2018/wp-content/uploads/2020/08/stop-banner.png)
/* Rani Randell
rrandell@andrew.cmu.edu
Section A
Project 7 */

function setup() {
    createCanvas(400, 400);
}

function draw() {
    background(255, 250, 180) //pastel pallette

    x = constrain(mouseX, 0, width);
    y = constrain(mouseY, 0, height);

    push();
    translate(width, height);
    drawHypotrochoid();
    pop();
}

function drawHypotrochoid() {

    for (var i = 0; i < TWO_PI; i ++) {
       var a = map(y, 0, mouseX, 0, height);
       var b = map(x, 0, mouseY, 0, width);

        x = (a - b) * cos(i) + 200 * cos(((a-b)/b) * i); //equations
        y = (a - b) * sin(i) - 200 * sin(((a-b)/b) * i); // cited at bottom

        noFill();
        stroke(180, 150, 255);
        strokeWeight(1);
        ellipse(-200, -200, x, y); //lavendar ellipse
        stroke(0, 0, 255);
        rect(-200, -200, x, y); //blue rectangles
        stroke(255, 250, 0) //clear yellow
        ellipse(-100, -100, x / .5, y / .5)
        stroke(255, 100, 240); //hot pink concentric circles
        ellipse(-300, -300, x * .5, x * .5)

    }
    //link to eq: http://mathworld.wolfram.com/Hypotrochoid.html
}
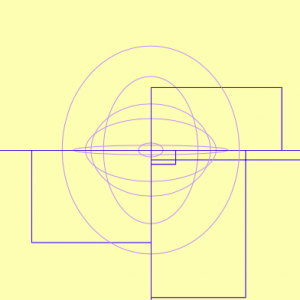
I really wanted this project to feel like an explosion of lines and color, so i mainly experimented with the various ellipses and rectangles after implementing the equations for a hypotrochoid. I included a process pic below: