Alessandra Fleck – Project 07

sketch

//Name: Alessandra Fleck 
//Class Section : B
//Email: afleck@andrew.cmu.edu
//Project-07


var Points = 500; //more points makes smoother curves
var Epitrochoid = 0; 

var x;
var y;


function setup() {
    createCanvas(480, 480);
    frameRate(40); //more frames = clearer motion
}

function draw() {
    background(0); // set background to black
    // draw the Epitrochoid

    push();
    translate(300, height / 2); //locate at upper left corner
    drawEpitrochoidCurve_01();
    //move second curve to lower right corner
    translate(width / 10, height/10);
    drawEpitrochoidCurve_02();
    //move second curve to lower right corner
    translate(width / 60, height/60);
    drawEpitrochoidCurve_03();
    pop();
}


function drawEpitrochoidCurve_01() { // for the curve on the top left corner
    
    
    var a =  40.0;
    var b = a / 0.2;
    var h = constrain(mouseY / 10.0, 0, b);
    var t;
    var mX = mouseX / 100.0; // mouse move over moves shape slower as value is larger
    var r = map(mouseX,0,width/0.8,0,1); //pulsing movement
    
    beginShape();
    fill(40,41,35);
    for (var i = 0; i < Points; i++) {

        stroke('red'); //add red to vibration lines
        strokeWeight(3);
        vertex(x, y);
        var t = map(i, 0, Points, 0, TWO_PI*3); // mess with curves within shapes

        //Parametric equations for Epitrochoid Curve
        x = r* ((a + b) * cos(t) - h * cos((t * (a + b) / b) + mX));
        y = r* ((a + b) * sin(t) - h * sin((t * (a + b) / b) + mX));
        
    }
    endShape(CLOSE);
    
}

function drawEpitrochoidCurve_02() { //for the curve on the bottom corner


    var a =  55.0;
    var b = a / 0.25; //degree of displacement
    var h = constrain(mouseY / 20.0, 0, b);
    var t;
    var mX = mouseX / 50.0;
    
    
    beginShape();
    fill(0);
    for (var i = 0; i < Points; i++) {
        stroke('red'); //add red to vibration lines
        strokeWeight(3);
        vertex(x+200, y+200);//set center point for the epitrochoid
        var t = map(i, 0, Points, 0, TWO_PI*3); // mess with curves within shapes
        
        //Parametric equations for Epitrochoid Curve

        x = (a + b) * cos(t) - h * cos((t * (a + b) / b) + mX);
        y = (a + b) * sin(t) - h * sin((t * (a + b) / b) + mX);
        
    }
    endShape(CLOSE);
    
}

function drawEpitrochoidCurve_03() { //for the curve on the bottom corner
    
    //light white line curves
    
    var a =  40.0;
    var b = a / 0.25; //degree of displacement
    var h = constrain(mouseY / 10.0, 0, b);
    var t;
    var mX = mouseX / 50.0;
    
    
    beginShape();
    fill(40,41,35);
    for (var i = 0; i < Points; i++) {
        stroke(255); //add red to vibration lines
        strokeWeight(1);
        vertex(x+200, y+200);
        var t = map(i, 0, Points, 0, TWO_PI*3); // mess with curves within shapes
        
        //Parametric equations for Epitrochoid Curve

        x = (a + b) * cos(t) - h * cos(mX + ((a + b) / b) + mX);
        y = (a + b) * sin(t) - h * sin(mX + ((a + b) / b) + mX);
        
    }
    endShape(CLOSE);
    
}

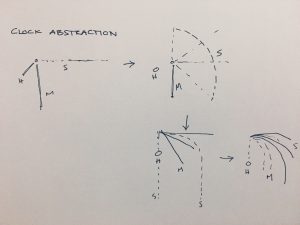
//http://mathworld.wolfram.com/Epitrochoid.html

For this project I just wanted to play with using the “b” variable in the parametric equation for an epitrochoid and using that variable as the axis for the degree of change in the movement. I did struggle a bit with the vertex parameter so if I continue this project that is what I would look to refine.

Alessandra Fleck – Looking Outwards – 07

For this analysis on data visualization artists, I wanted to look into the work of American scientist, Martin Wattenberg. With experience in working at IBM and co-leading Google PAIR, Wattenberg carries an interest in the different connections technology can make and the narrative and beauty that emerges from those connections. One such project that takes computation and captures the narrative/ storytelling of it that I find particularly interesting is Wattenberg’s Shape of Song exhibition.

(The above image shows a matrix of Wattenberg’s entire Shape of Song collection. The program to create these intricate forms was written in Java)

The purpose of the Shape of Song exhibition was to create works through the connection of different characters in a musical piece. As seen in the image below these connection would occur in the form of arches, which vary in size and span according to the distance between relating parts in the musical composition. Wattenberg achieved these forms by implementing the music in the form of a MIDI file, which was then separated and analyzed in subsets of “tracks.”

Once this process is done in several iterations through the course of the entire piece, the resulting work is a large set of connecting arches with different dynamic qualities.

(The image above shows a diagram of the Goldberg Variations. The AABB structure of the composition can be seen in the way that the piece can be broken up into two separate parts.)

(The image above shows one completed work from the Shape of Song exhibition that captures the different connections and repetitions of musical components in Vivaldi’s Autumn, Four Seasons composition. )

What I find most interesting about this form of data visualization is the way in which it looks to find connections in something that seemingly has a set beginning and end. The way in which the data is visualized in this manner shows another interesting way of interpreting music and how it is structured by taking something that we hear and mapping it into something that we can see.


Read More:

http://turbulence.org/Works/song/method/method.html

http://www.bewitched.com/song.html


Alessandra Fleck – Project 06 Clock

sketch

//Name: Alessandra Fleck 
//Class Section : B
//Email: afleck@andrew.cmu.edu
//Project-06


function setup() {
    createCanvas(480, 480);
    noStroke();
}

function draw() {
    background(255);

    //set for for hour,minutes and seconds
    var h = hour(); 
    var m = minute();
    var s = second();

    //blue waves going down
    for (var i = 0; i < (s*10); i ++) { //increments at x10 the distance
        stroke(179,223,222);
        strokeWeight(0.3);
        line(i*4, 0, width, i); 
        line(i*2, 0, height * 2, i); 
        line(i*4, 0, height * 4, i); 
        line(i*2, 0, height * 0.75, i + 20); 
        line(i*4, 0, height * 0.6, i + 20); 
        line(i*2, 0, height * 0.5, i + 100); 
    }

    //brown waves going down
    for (var i = 0; i < (s*20); i +=5) { //increments at x20 the distance
        stroke(255);
        strokeWeight(0.5);
        line(i*2, 0, width, i); 
        line(i*2, 0, height * 2, i); 
        line(i*2, 0, height * 4, i); 
        line(i*2, 0, height * 0.75, i + 200); 
        line(i*2, 0, height * 0.6, i + 200); 
        line(i*2, 0, height * 0.5, i + 600); 
    }

    //black waves going down for the minutes
    for (var i = 0; i < m; i +=5) { //strings will slowly branch out black for every minute
        stroke(0);
        strokeWeight(0.3);
        line(i*2, 0, width, i); 
        line(i*2, 0, height * 2, i); 
        line(i*2, 0, height * 4, i); 
        line(i*2, 0, height * 0.75, i + 200); 
        line(i*2, 0, height * 0.6, i + 200); 
        line(i*2, 0, height * 0.5, i + 600); 
    }

    //white circle_01
    fill(100,10+(s*50),255);
    noStroke();
    ellipse(50,s*10,30,30);

    //white circle_01_hour
    fill(255);
    stroke(0);
    strokeWeight(1);
    ellipse(50,h*10,30,30);


}

For this project I wanted the abstraction of the clock to be something that is completed as time passes. Instead of the long skinny arms of a clock being the seconds passing, I instead made them the minute hands and had the seconds move down in a parametric curve to create a wave in the background.

The sketch above shows a bit of the process in the form of the clock.

Alessandra Fleck – Looking Outwards – 06

To explore the realm of randomness in computational art, I decided to look into a project that integrates traditional craft alongside digital work. Random Number Multiples is a limited edition artwork collection created by data visualization artists Jer Thorp and Marius Watz. The collection seeks to integrate analog work alongside the programming, digital aspect. This hybridization of techniques adds a subtle touch of art into the randomization of data. As the artists claim, modern day art viewed on the computer can have a cold essence to it. When bringing that digital art onto a printed medium however, the effect can be more sensual, despite its digital randomness. This idea of digital randomness being combined with analog mediums to evoke an emotion is something I think is very interesting. As lots of data is being filtered into our lives on a daily basis, it is neat to see such data being presented as “art” where the randomness acts as an expression of the sort of tension and branching of the different data sets interacting with one another.

[the image above depicts a finished data visualization art piece after undergoing a post process in analog medium]

[below  is how they print out the data visualization art pieces and prepare to work on in a more traditional medium. The different colors come from the different paths and types of data being visualized.]

[The above image looks into the fine detail of the printed work. Some other completed works done by the artists can be seen below ]

There is not much said in how the artists generate the “randomness” in their work algorithmically. It can be speculated however, that there might exist some sort of tree data structure to help determine the different branches of the work (Similar to the snag tree method shown below).

The creative sensibilities of the work really rely on the means by which the artists utilize traditional methods of visualization with digital methods. The entire hybridization of the work is important in how the artists author their creativity.


Read more about the work:

Computational Art, From Screen to Paper: Prints by Jer Thorp, Marius Watz

http://www.triangulation.jp/2011/02/random-number-multiples.html


Alessandra Fleck – Looking Outwards – 05

For this looking outwards I wanted to explore a project that I find particularly interesting by former Apple programmer Ben Haller called Attraction Basins. Each of the different art pieces created in this project are made using a form of “equation root finding.” The pieces in this project are very much related to the Mandelbrot Set and the idea of points on a place relating to points on an image, to which the root-finding is utilized iteratively.

The first image below titled “Carapace” was generated using  Newton’s Method, which has to do with the idea of finding roots based on a process of successive approximations.

(The image above showing “Carapace” by Ben Haller)

The colors that occur in the pieces are dependent on the length of time and type of root that was converged. At these points of convergence also note the “basins” that occur in these areas. The other piece from Ben Haller’s gallery I wanted to look at is called “Energy.”

(The image above shows “Energy” by Ben Haller)

This piece is based on the Secant Method which is another root finding algorithm that takes a “region of interest” and assumes a linear relationship of the function  being analyzed. A graph of how the secant method works can be seen below. Note the relationship between the graph and the art piece generated from it.

I find these 3D Computer Graphics interesting because they relate directly to some form of root finding. So as diverse as the two might read in visual language, there is a common underlying method that carries across all the pieces.

Read more at:

http://www.sticksoftware.com/gallery/basins.html

http://mathworld.wolfram.com/SecantMethod.html

https://en.wikipedia.org/wiki/Newton%27s_method


Alessandra Fleck – Project 05 Wallpaper

sketch

//Name: Alessandra Fleck 
//Class Section : B
//Email: afleck@andrew.cmu.edu
//Project-05


function setup() {
    createCanvas(600, 500);
    noStroke();
}

function draw() {
    background(0);

    // Base ellipses in a dull gray

    for (var y = 0; y < height+25; y += 50) {
        for (var x = 0; x < width+25; x += 50) {
            stroke(255);
            strokeWeight(0.40);
            fill(62,81,82);
            ellipse(x, y, 50, 50);
        }
    }

    //negative space from circles

    for (var y = 0; y < height+25; y += 50) {
        for (var x = 0; x < width+25; x += 50) {
            fill(29,26,34);
            quad(x+35, y+30, x+90, y+25, x+55, y+70, x+30, y+80);
        }
    }

    //creates the small white checks by twisting a smaller quadrangle 

    for (var y = 0; y < height+25; y += 50) {
        for (var x = 0; x < width+25; x += 50) {
            fill(255);
            quad(x+15, y+20, x+30, y+15, x+15, y+50, x+30, y+20);
        }
    }
     // Creates the small "fish eyes" in a dull gold

    for (var y = 0; y < height+25; y += 50) {
        for (var x = 0; x < width+25; x += 50) {
            fill(151,160,127);
            arc(x + 80, y + 80, 10, 10, 5, PI + QUARTER_PI);
        }
    }

    //olive shape with organe strike through edge of gold "fish eyes"
    for (var y = 0; y < height+25; y += 50) {
        for (var x = 0; x < width+25; x += 50) {
            fill(151,160,127);
            stroke(255, 102, 0);
            fill(53,74,59);
            line(x + 20, y + 20, x+ 10, y+10);
            line(x+20, y+20, x+50, y+50);
            stroke(0, 0, 0);
            bezier(x+50, y+50, x+50, y+10, x+20, y+20, x+50, y+50);
        }
    }

    noLoop(); // save computation -- no animation
}

For this project, I wanted to try making something inspired by Japanese print. Such as the image shows below.

Image result for japanese print patterns

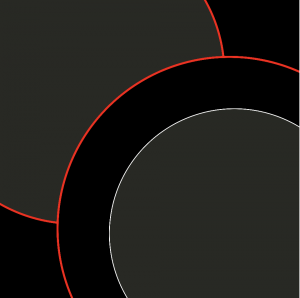
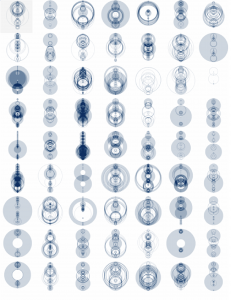
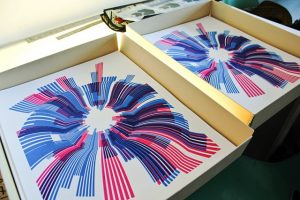
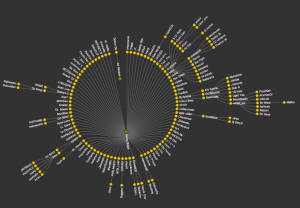
I played with the idea of two directional patterns. Where there is a dynamic flow in one direction and a sharp streak in another. This can be seen in the cool green curvy background with the bright orange streaks in the opposite direction. One thing I would work on if I were to continue this project, if is the fine detail accuracy of each stroke to one another (making sure that they are are flush with one another).

Alessandra Fleck – Project 04 String Art

sketch

//Name: Alessandra Fleck 
//Class Section : B
//Email: afleck@andrew.cmu.edu
//Project-04


function setup() {
    createCanvas(480, 300);
    strokeWeight(0.3);
}

function draw() {
    background(0);
    
    //blue back lines (no curve)
    for (var i = 0; i < 400; i += 6) {
    	stroke(155,236,255);
      	line(i, 0, 1.5*i, i); //top right corner start
      	//line(x1,y1,x2,y2);
      	line(2*i, 300, width, i); //bottom left corner start 
    }

    //secondary layer for color in light blue

    for (var i = 0; i < width; i += 3) {
      	stroke(179,223,222);
      	strokeWeight(0.3);
      	line(i*2, 0, width, i); //top right curve with lines
      	line(i*2, 0, height * 2, i); //next curve next to curved line 1
      	line(i*2, 0, height * 1, i); //next curve next to curved line 2
      	line(i*2, 0, height * 0.75, i + 20); //next curve next to curved line 3
      	line(i*2, 0, height * 0.6, i + 20); //next curve next to curved line 3
      	line(i*2, 0, height * 0.5, i + 100); //next curve next to curved line 3
    }

    //third layer for color

    for (var i = 0; i < width; i += 3) {
      	stroke(220,183,225);
      	strokeWeight(0.3);
      	line((i*2)+100, height, 300, i); //top right curve with lines
      	
      	line((i*2)-100, height, height * 1, i); //next curve next to curved line 2
      	
      	line((i*2)-100, 0, height * 0.6, i + 20); //next curve next to curved line 3
      	line(i*2, 0, height * 0.5, i + 100); //next curve next to curved line 3
    }


}

For this project, I wanted to try understanding how to take a line and manipulative it into a twisting curve. To invert the curve and create the twist like form, I used the height variable in the x2 coordinate section and multiplied it by a decimal to decrease the dynamic scale of the curve. I hope to be able to use this technique for something more symmetrical next time.

Alessandra Fleck – Looking Outwards 04 : Sound Art

One sound and computation project I found that I thought was interesting is th
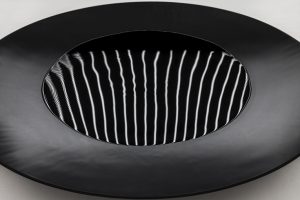
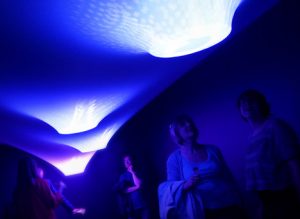
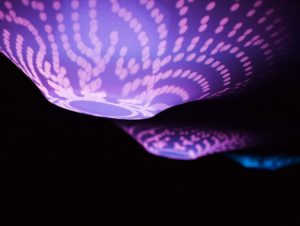
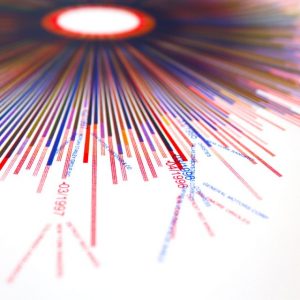
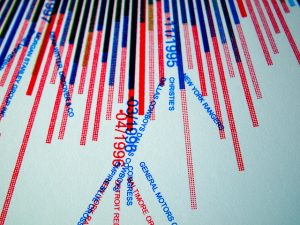
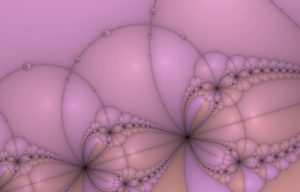
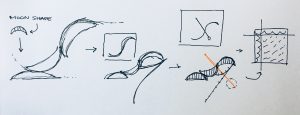
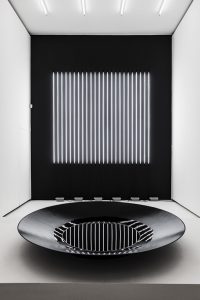
e Reflector Distortion project by Carsten Nicolai. What I find most interesting about this project is the way in which the computational aspect is not transcribed visually on a screen but rather through the subtle moves in the water dish.

The premises of this project stem from inputting sound into an algorithm that then associates that sound with a pattern and then outputs that sound in the source of a low frequency sound that replicates that pattern in the water basin.

(on the image above, the art piece is set in a white box room with clean, neon white lights as the only source of light. There was much detail put into the room alone to ensure that the cleanliness of the exhibit and sound distortions is exhibited well)

Rather than exhibiting the sound in the form of music, this project focuses on the frequency of sound as a basis of art. Enable to clearly visualize these changes in frequencies, the art piece uses a low black basin of water with a line of white neon lights mounted on the ceiling above the basin to reflect the lines in the basin and male the sound changes visible.

Exhibiting sound in the form of art is a very interesting track for visualizing what is not seen on the computer. The algorithms that were used to create this probably dealt along the lines of transcribing direct frequencies to points of a curve, then using an algorithm similar to what is used in Trapcode soundkeys to take those curves and based on the level of frequency, then exhibit that curve at a higher or lower visual mode.

(the image above shows a detail of the sound basin with the neon white light reflecting off the surface of the water in the dish)

Carsten Nicolai – reflektor distortion from studio carsten nicolai on Vimeo.

Sources:

http://carstennicolai.de/?c=works&w=reflektor_distortion

12 Sound Artists Changing Your Perception of Art

Alessandra Fleck – Looking Outwards – 03

For this entry I wanted to look at an architect that takes parametric design methodology into high detail in her architectural designs as well as interpretive work. The Parametric Space Exhibition brought together by Zaha Hadid Architects and motion designers, Wahlberg. These ceiling embedded mechanisms move both physically and with their illuminance patterns according to the movement of those entering the exhibit. The information of those moving through the exhibit are taken from two laser scanners in the room. This information is then translated into parabolic motion in large cylinders driving the motion of the ceiling membrane which also corresponds to the RGB light reaction to the different heights and movements of the cylinders. The light is emitted in particle form, implying a sort of mesh to point grid algorithm that transcribes a motion, project it onto a mesh grid, then maps points onto key intersecting regions.


(The image above shows how the different mechanisms in the ceiling react in light to the visitor.)

The software and algorithms utilized in the project are not entirely specified. However, I believe it is a combination of grasshopper script mapped onto a 3D parabolic generated model in Rhino.


(The RGB particle light show is mapped onto the membrane of the ceiling.)

For more information:

Parametric Space by Zaha Hadid Architects


https://www.archdaily.com/396923/parametric-space-zaha-hadid-architects-kollision-cavi-wahlberg

Alessandra Fleck – Project 03 – Dynamic Drawing

sketch

//Name: Alessandra Fleck 
//Class Section : B
//Email: afleck@andrew.cmu.edu
//Project-03

var angle = 0;

function setup() {
    createCanvas(640, 480);
}
function draw() {

    // set background to night color
    background(28, 41, 74);
    noStroke();

    //change background color
    if (mouseX < (width / 2)) {
        background (148, 236, 223); //change background to day when mouse is in left of halway
    }

    //Create the Sun and Moon
    //Moon
    fill(215, 215, 215);
    var m = max(min(mouseX, 400), 0);
    var size = m * 200 /400;
    ellipse(450 + m * 190.0 / 480, 100.0, size, size);

    //Sun
    fill(214, 212, 161);
    size = 100 - size;
    ellipse(200 + m * 190.0 / 480, 200.0, size + 10, size);


    //rolling hill-01 (left)
    push();
    translate (100,600);
    rotate(radians(angle));
    fill(115, 99,87);
    ellipse(-200,150,500,500);
    pop();

    //rolling hill-02 (right)
    push();
    translate (100,600);
    rotate(radians(-angle));
    fill(115, 99,87);
    ellipse(200,50,500,500);
    pop();

    fill(51,41,32); // dark back hill
    ellipse(0, 500, 750, 800);

    //First Tree left
    fill(95, 150, 124);
    rect(opp -50, 40, 20, 400);

    //Hill in the far back
    fill(80,66,56);
    var m = max(min(width - mouseX, 800), 400);
    var size = m * 100 / 450;
    ellipse(100 + m * 100 / 480, 400, size + 400, 300);

    //Hill on the right that moves against cursor
    fill(115, 99,87);
    var m = max(min(width - mouseX, 800), 400);
    var size = m * 100 / 450;
    ellipse(500 + m * 100 / 480, 400, size + 300, 200);
    

    //Solid to cover the hills

    fill(176, 169, 138);
    rect(0, 400, 700, 100);
    fill(176, 169, 138); // solid hill on left (brown)
    ellipse(0, 400, 700, 100);
    fill(115, 99,87); // solid hill on left (brown)
    ellipse(0, 400, 650, 80);
    
    fill(150,125,107); // solid hill on right (brown)
    ellipse(400, 450, 650, 90);

    
    //Bushes
    var opp = width - mouseX; 
 
    fill(87, 129, 59); // bush front
    ellipse(mouseX-500, 350, 800, 60);

    fill(73, 83, 65); //ground floor
    ellipse(mouseX - 300,380,600,80);

    fill(107, 147, 88); // bush behind
    ellipse(mouseX-400, 400, 800, 80);
    

    angle = angle + 3;
 
    //Tree_01
    fill(42, 22, 33); //tree trunk
    rect(opp, 200, 40, 400);
    fill(18, 70, 43); //tree top
    ellipse(opp,200,250,200);
    ellipse(opp,300,350,200);

    //Tree_02
    fill(83, 71, 65); //medium tree trunk
    rect(opp + 95, 100, 30, 400);
    

    //Tree_03
    fill(42,22,33);
    rect(opp + 50, 50, 30, 400);
    fill(100, 120, 69); //tree top-02
    ellipse(opp+100,100,150,200);

    //Tree_04
    fill(98, 66, 36);
    rect(opp -50, 40, 20, 400);
    fill(87, 129, 59); //tree top
    ellipse(opp - 80,100,100,100);
    fill(100, 120, 69); //tree top-02
    ellipse(opp,200,150,200);

    fill(107, 147, 88); //tree top-light
    ellipse(opp,150,100,100);

    fill(77, 83, 65); //tree top
    ellipse(opp+100,200,150,200);

    fill(107, 147, 88); //tree top-light
    ellipse(opp - 60,300,100,100);

    fill(107, 147, 88); //tree top-light
    ellipse(opp + 150,250,80,60);

    fill(96, 166, 104); //ground floor
    ellipse(opp - 60,480,500,100);
    

}


For this project I wanted to use the simple movements we learned with rotation and translation of objects and use ellipses to make rolling hills and scenery. The inspiration for this project came from me working on it indoors and wanting to go outside.