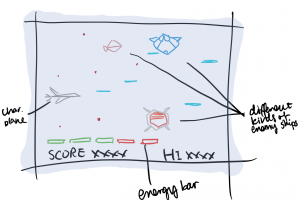
For the final project of this class, I’m going to collaborate with Min Jun Kim. We are thinking about doing a simple video game which draws inspiration from Gradius. We are planning to make three different stages of the game: first two are competing against small enemies and the last stage will be against the boss, a black hole. We use be using objects and interactive background and sound. The game will be set in a carefully designed galaxy theme that varies with each stage. There will be multiple different characters to choose from and about 10 kinds of enemy ships.
A simple draft of the first two stages of our game.
Inspiration 1: Lighting Changes with SoundThe Company by Nocte at Bring to Light Festival NYC
Nocte is a London-based team of expert that creates and designs light installations for different kinds of situations. They have been commissioned by multiple famous bands and exhibitions to create interactive visual connections that amplify the overall effects of the event. The Company is made up of 76 tungsten lamps the the brightness and on/off switch of each light bulb is interactive with the background music. The overall effect of this project is magnificent and I’d love to see it in person one day.
I think Nocte’s interactive lighting installation will be a good inspiration for my project because it will help me to build a more atmospheric background for my game-based project. I want to make the lighting and graphics of my project change along with the progression the game.
Inspiration 2: City Icon by Marcin Ignac at the Sustainable City Initiative at London in 2012.
Marcin Ignac is a Polish Artist and Programmer based in London. His work often involves visualizing data, creating artificial life forms and combining technology with art. City Icon is a series of six simulations representing different representation of London. This project is very relevant to my project because it can be incorporated into making themes and backgrounds of the game I’m making which is supposedly galaxy based.
// Han Yu
// Section D
// hyu1@andrew.cmu.edu
// Project 11 Compostion

var ttl;

function setup() {
    createCanvas(400, 400);
    background(255, 200, 200);
    ttl = makeTurtle(width/2, height/2);
    ttl.setColor(255);
    ttl.setWeight(2);
    ttl.penDown();
    frameRate(50);
}

function draw() {
	var step = (frameCount/150);
	ttl.forward(step);
	ttl.left(5);
}

function mousePressed() {
	ttl = makeTurtle(mouseX, mouseY);
	var c = [255, 'purple', 255, 155]; //maximize the chances of getting a white stroke
	ttl.setColor(c[floor(random(0,4))]);
	ttl.setWeight((random(0,2)));

}

function turtleLeft(d){this.angle-=d;}function turtleRight(d){this.angle+=d;}
function turtleForward(p){var rad=radians(this.angle);var newx=this.x+cos(rad)*p;
var newy=this.y+sin(rad)*p;this.goto(newx,newy);}function turtleBack(p){
this.forward(-p);}function turtlePenDown(){this.penIsDown=true;}
function turtlePenUp(){this.penIsDown = false;}function turtleGoTo(x,y){
if(this.penIsDown){stroke(this.color);strokeWeight(this.weight);
line(this.x,this.y,x,y);}this.x = x;this.y = y;}function turtleDistTo(x,y){
return sqrt(sq(this.x-x)+sq(this.y-y));}function turtleAngleTo(x,y){
var absAngle=degrees(atan2(y-this.y,x-this.x));
var angle=((absAngle-this.angle)+360)%360.0;return angle;}
function turtleTurnToward(x,y,d){var angle = this.angleTo(x,y);if(angle< 180){
this.angle+=d;}else{this.angle-=d;}}function turtleSetColor(c){this.color=c;}
function turtleSetWeight(w){this.weight=w;}function turtleFace(angle){
this.angle = angle;}function makeTurtle(tx,ty){var turtle={x:tx,y:ty,
angle:0.0,penIsDown:true,color:color(128),weight:1,left:turtleLeft,
right:turtleRight,forward:turtleForward, back:turtleBack,penDown:turtlePenDown,
penUp:turtlePenUp,goto:turtleGoTo, angleto:turtleAngleTo,
turnToward:turtleTurnToward,distanceTo:turtleDistTo, angleTo:turtleAngleTo,
setColor:turtleSetColor, setWeight:turtleSetWeight,face:turtleFace};
return turtle;}
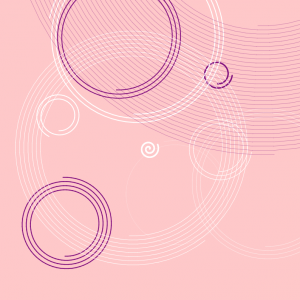
Spirals are my favorite patterns so I wanted to make my project with them. It was fun making variations in color and stroke but setting the steps for spirals are hard. Overall, doing this project has definitely made me more familiarized with turtles.
Riz Maslen is a British electronic music artist, producer, singer and multi-instrumentalist. She is one of the most recognized female composers in the field of post-techno experimental electronics. She first started out experimenting electronic music in 1996. Malsen had produced an extensive profile of music under the names Neotropic and Small Fish with Spine and performed in huge music festivals like Coachella.
Skirting on Thin Ice is performed by Riz Malsen on the Opening of London’s Artisit Quarter in 2011. Aside from making music and programming, Malsen also produces photographic slides and films as a live background during her performance as a complimentary medium to present a more holistic and multi-media experience for her audience. Just like the other tracks by Malsen I’ve came across when researching for this project, Skirting on Thin Ice has the same warm and mellow vibe that brings out the perfect amount of chill and energy. There are also slight variations nicely woven into the whole song which keep listeners eager to find out what’s next. I am impressed by the vast amount of creativity and innovation found in Malsen’s productions and I especially like this opening song as it somehow brings out my inner peace whenever I listen to it.
// Han Yu
// Section D
// hyu1@andrew.cmu.edu
// Project 10 Generative Landscape

var terrainSpeed = 0.0005;
var terrainDetail = 0.01;
var terrainD1 = 0.0005;
var terrainS1 = 0.0002;

var fish1 = "https://i.imgur.com/pw06Fwc.png";
var fish = [];
var fishy1;

function preload() {
	fishy1 = loadImage(fish1);
}

function setup() {
    createCanvas(480, 300);
    //create an initial collection of fish
    for (var i=0; i<10; i++) {
    	var rx = random(width*5);
    	fish[i] = makeFish(rx);
    }

    frameRate(10);
}

function draw() {
    background(255);
    //sun
    noStroke();
    fill(252,163,41);
    ellipse(80, 60, 70, 70);

    //mountain
    noFill(0);
    stroke(135,120,108)
    beginShape();
    for (var x = 0; x < width; x++) {
        var t = (x * terrainDetail) + (millis() * terrainSpeed);
        var y = map(noise(t),0,1,20,height)-height/4;

        vertex(x, height);
        vertex(x, y);
    }
    endShape();
    fill(135,120,108,100);
    noStroke();

    //water-top
    beginShape();

    stroke(119,209,249,150);
    for (var x1 = 0; x1 < width; x1++) {
        var t1 = (x1 * terrainD1) + (millis() * terrainS1);
        var y1 = map(noise(t1),0,1,20,height);
        vertex(x1, height);
        vertex(x1,y1);
    }
    endShape();

    //water-bottom
	beginShape();

    stroke(119,209,259);
    for (var x1 = 0; x1 < width; x1++) {
        var t1 = (x1 * terrainD1) + (millis() * terrainS1);
        var y1 = map(noise(t1),0,1,28,height);
        vertex(x1, height);
        vertex(x1,y1);
    }
    endShape();

    //fish
    push();
    translate(0.1 * width, 0.1 * height);
    scale(0.8);

    scale(0.2,0.2);

    updateAndDisplayFish();
    addNewFishWithProbability();

}

function updateAndDisplayFish() {
	for (var i = 0; i < fish.length; i++) {
		fish[i].move();
		fish[i].display();
	}
}


function addNewFishWithProbability() {
	var newFishLikelihood = 0.05;
	if (random(1) < newFishLikelihood) {
		fish.push(makeFish(-300));
	}
}

function fishMove() {
	this.x += this.speed*(1/this.size);
}

function fishDisplay() {
	push();
	scale(this.size, this.size);
	translate(this.x*(1/this.size), this.y*(1/this.size));

	image(fishy1,0,0);
	pop();
}


function makeFish(birthLocationX) {

    var fishy = {x: birthLocationX,
    		size: random(0.3, 0.6),
    		y: random(0.8*height*(1/0.2), height*(1/0.2)),
            speed: random(1,5),
            move: fishMove,
            display: fishDisplay};
    return fishy;
}
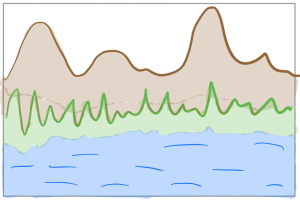
I started out thinking to do a project on natural landscape with mountain, water and grassland. But as I dived into the project, I found the overall scene rather dull and lifeless so I decided to focus on the underwater scene with fish instead.
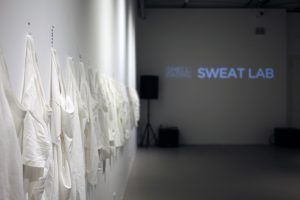
Tega Brain is an Australian critical new media artist and provocateur as well as an environmental engineer. She is famous for creatively using information systems to present data, taking the form of online interventions and experimental infrastructures. Brain is able to explore the strengths of multiple platforms and utilize them in eccentric engineering which intersects art, engineering and ecology. She is currently an assistant professor teaching at Integrated Digital Media department of New York University. Her works are exhibited in a number of museums around the world. One of her works that I found most interesting is called Smell Dating, which is the world’s first smell based dating service that matches people based on feedback of smelling each other’s odor.
Smell Dating exhibition in Shanghai, China.
According to a number of research, it shows that smell is the most evocative experience by human and can be used to find links to a number of information such as age, gender and even predisposition to illness. Brain’s Smell Dating service invites people to trust their olfactory intuition and choose the other halves based on their smell signatures. In order to participate the service, people will need to exchange their worn smelly shirts which are designed by the smell dating team. They will receive random shirts by other participants and if both participants mutually liked the smell of each other, they will exchange phone numbers and ready to move on to the next stage of their relationships. I like how Brain can realize such a vague scientific connection between scent and romantic attractions into a project that is very practical and quantifiable.
// Han Yu
// Section D
// hyu1@andrew.cmu.edu
// Project 09 Portrait

var poolpic; //image variable
var pattern=["♛","♨","☆","♞","✌︎","🀧"]; //stores patterns to be drawn later

function preload() {
    var myImageURL = "https://i.imgur.com/f4kVoqD.jpg";
    poolpic = loadImage(myImageURL);
}

function setup() {
    createCanvas(600,400);
    background(95,171,188);
    poolpic.loadPixels();
}

function draw() {
    scale(0.333,0.333); //makes the original image smaller

    //location and color variable of each pattern
    var x = random(width*3);
    var y = random(height*3);
    var c = poolpic.get(x, y);
    var randomly = floor(random(0,5.9)); //pattern to be drawn
    var p = pattern[randomly];  //randmly picks an item from pattern

    noStroke();
    fill(c);
    textSize(random(30,80));
    text(p, x, y);
}
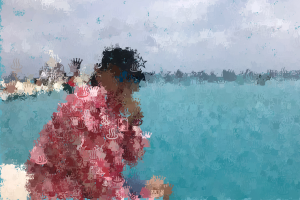
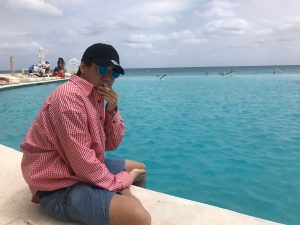
In this project I used a picture of my bf. I was inspired by cool symbols and characters used in other people’s projects so I decided to use an array of symbols that describes my bf in my project.
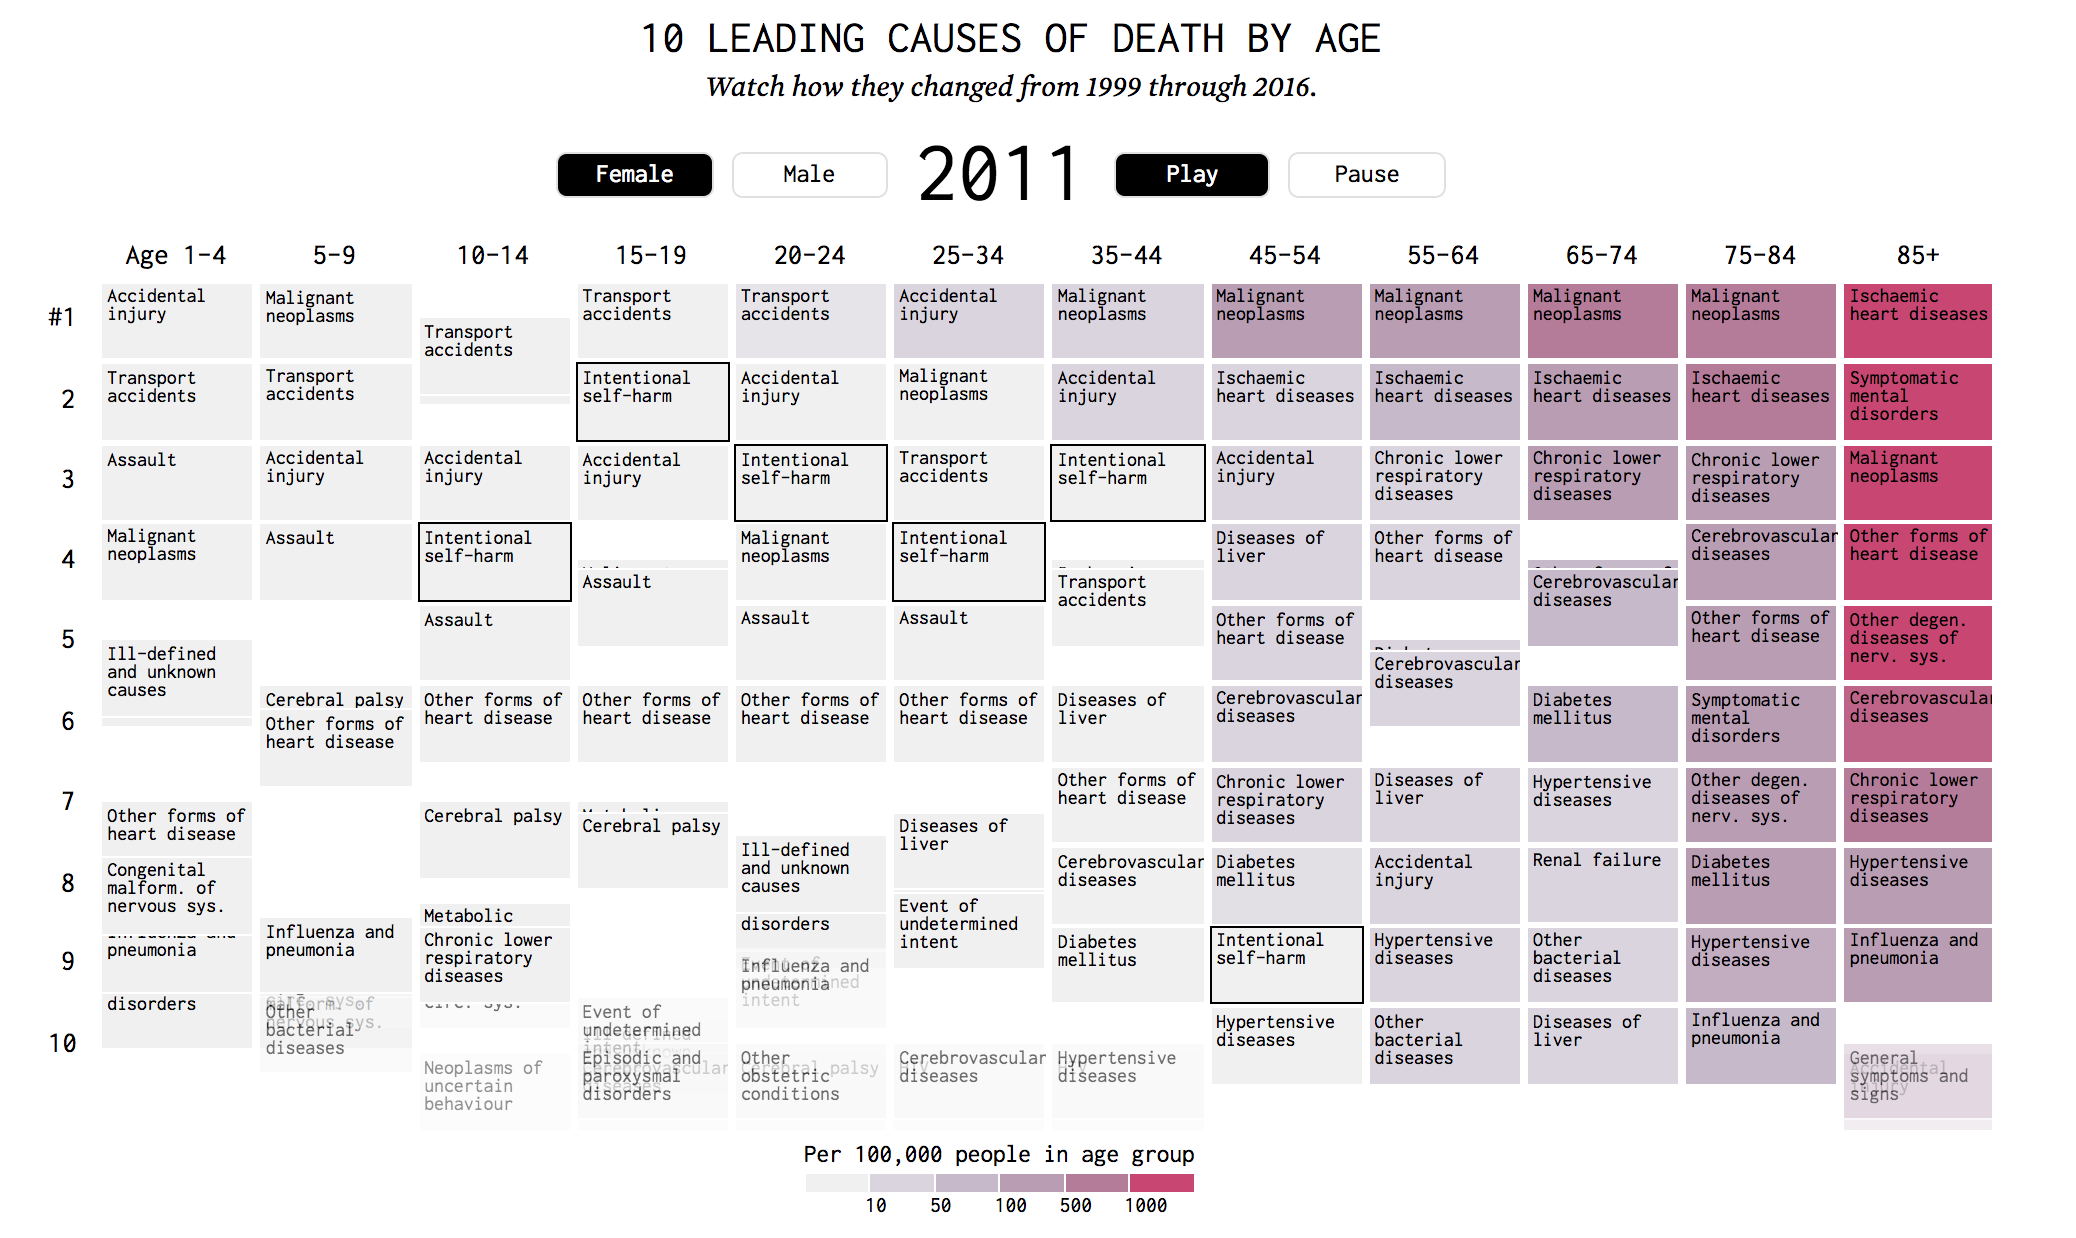
I found Min Jun Kim’s Looking Outwards 7 very interesting. He talked about a data visualization project called Shifting Causes of Death. Nathan Yau, creator of this project, used D3.js to show how causes of death changed over the years, across sex and age groups. You can see the different causes of death shifting up and down as years go by. For example, death of HIV gradually fell out the rankings as years go by but death of intentional self-harm is slowly climbing up over the years. I agree with what Min Jun said in his post that Nathan Yau managed to present “a vast amount of information in such a limited space and does it elegantly”. Just by looking at the gradually shifting data visualization, you can tell what’s the most cited causes of death and which cause is becoming increasingly common.
A screenshot of Nathan Yau’s Shifting Causes of Death at year 2011.
I also agree what Min Jun commented on the algorithm that is used to create this project. He said that a counting variable locates the data and a sorting algorithm that restores the structure of the graph each year. Adding on to his point, I think there also might be a overall mapping function that assigns different hues of red to each box of death cause based on the data processed earlier. Overall, I think this project is artistically crafted and successful to convey the information it contains.
Kate Hollenbach is an artist, programmer and educator based in Los Angeles. She works for Oblong Industries during the time she gave the speech at INSTINT. Oblong is a Los Angeles based company founded in 2006 that dedicates in designing interfaces and building gestural interactions. Hollenbach was the former director of Design and Computation at Oblong and under her leadership, Oblong came up with several groundbreaking products truly pioneered in the gestural interaction industry, which the company and many believed is the future of computers.
Oblong’s first project “Tamper” was commissioned by the university museum of Cal State. It is an interface that uses multiple surfaces to do different tasks and users can use gestures to browse through different video clips displayed at the museum. The project requires users to wear gloves that have reflective markers on them which is captured by the many cameras installed in the display room. The project was a success and fueled Oblong to continue their endeavors in gestural interactions.
Kate Hollenbach’s speech at INSTINT 2014 where she displayes “Temper” at 04:35.
Mezzanine is the flagship product of Oblong that realizes conference room collaboration through building a multi-screen environment. Users can embed multiple video and sources from their own computers on the screens around the room and even project them to virtual locations. I really admire the organic aspect of Mezzanine where every interactive elements feel natural. The creators of Mezzanine utilizes animations and other tools to maximize the power of gestural interactions and make users comfortable with the new technology.
// Han Yu
// Section D
// hyu1@andrew.cmu.edu
// Project 07

var nPoints = 200;

function setup() {
    createCanvas(400, 400, WEBGL); // create a 3D canvas
    frameRate(100);
}

function draw() {
    background(100);
    fill(250);
    rotateZ(millis() / 8000);
    stroke(250);
    drawFlower();
}

function drawFlower() {
    // http://mathworld.wolfram.com/Slinky.html
    var x;
    var y;
    var z;
    // variables inside the formula
    var p = constrain((mouseX / width), 0.0, 400);
    var q = constrain((mouseY / height), 0.0, 400.0);

    fill(200, 200, 255, 100.5);
    beginShape();
    stroke(250);
    for (var i = 0; i < nPoints; i++) {
        var t = map(i, 0, nPoints, 0, TWO_PI);

        // Flower(slinky):
        x = (PI+100*cos(10*q*t))*cos(t);
        y = (PI+100*cos(10*q*t))*sin(t);
        z = 1/2*p*t + 100*sin(10*p*t);

        vertex(x, y, z);
    }
    endShape(CLOSE);
}
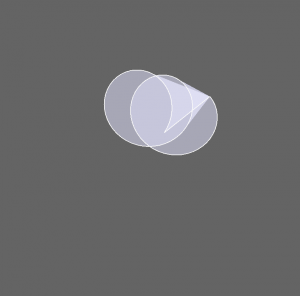
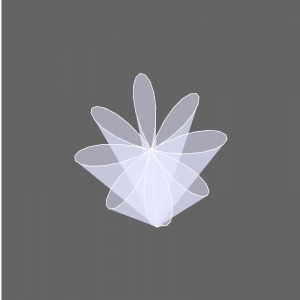
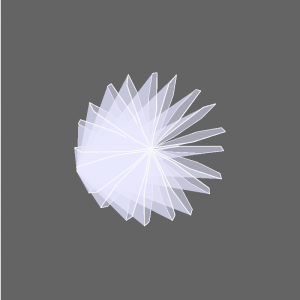
I used a slinky curve for my project. A slinky curve is a space curve which consists of a spiral wound around a helix. I altered it in order to show the formation of a flower. Overall I found this project is helpful with familiar with 3D plane and curves. Below are some screenshots of different stages of my project.
Start stage. Mouse at top left corner.Flower in formation.Final stage complex flower. Mouse at bottom right corner.
![[OLD FALL 2018] 15-104 • Introduction to Computing for Creative Practice](https://courses.ideate.cmu.edu/15-104/f2018/wp-content/uploads/2020/08/stop-banner.png)