Min Jun Kim- Looking Outwards 7

Nathan Yau’s Shifting Causes of Death
Nathan Yau’s Shifting Causes of Death after few seconds

Source: https://flowingdata.com/2018/10/02/shifting-death/

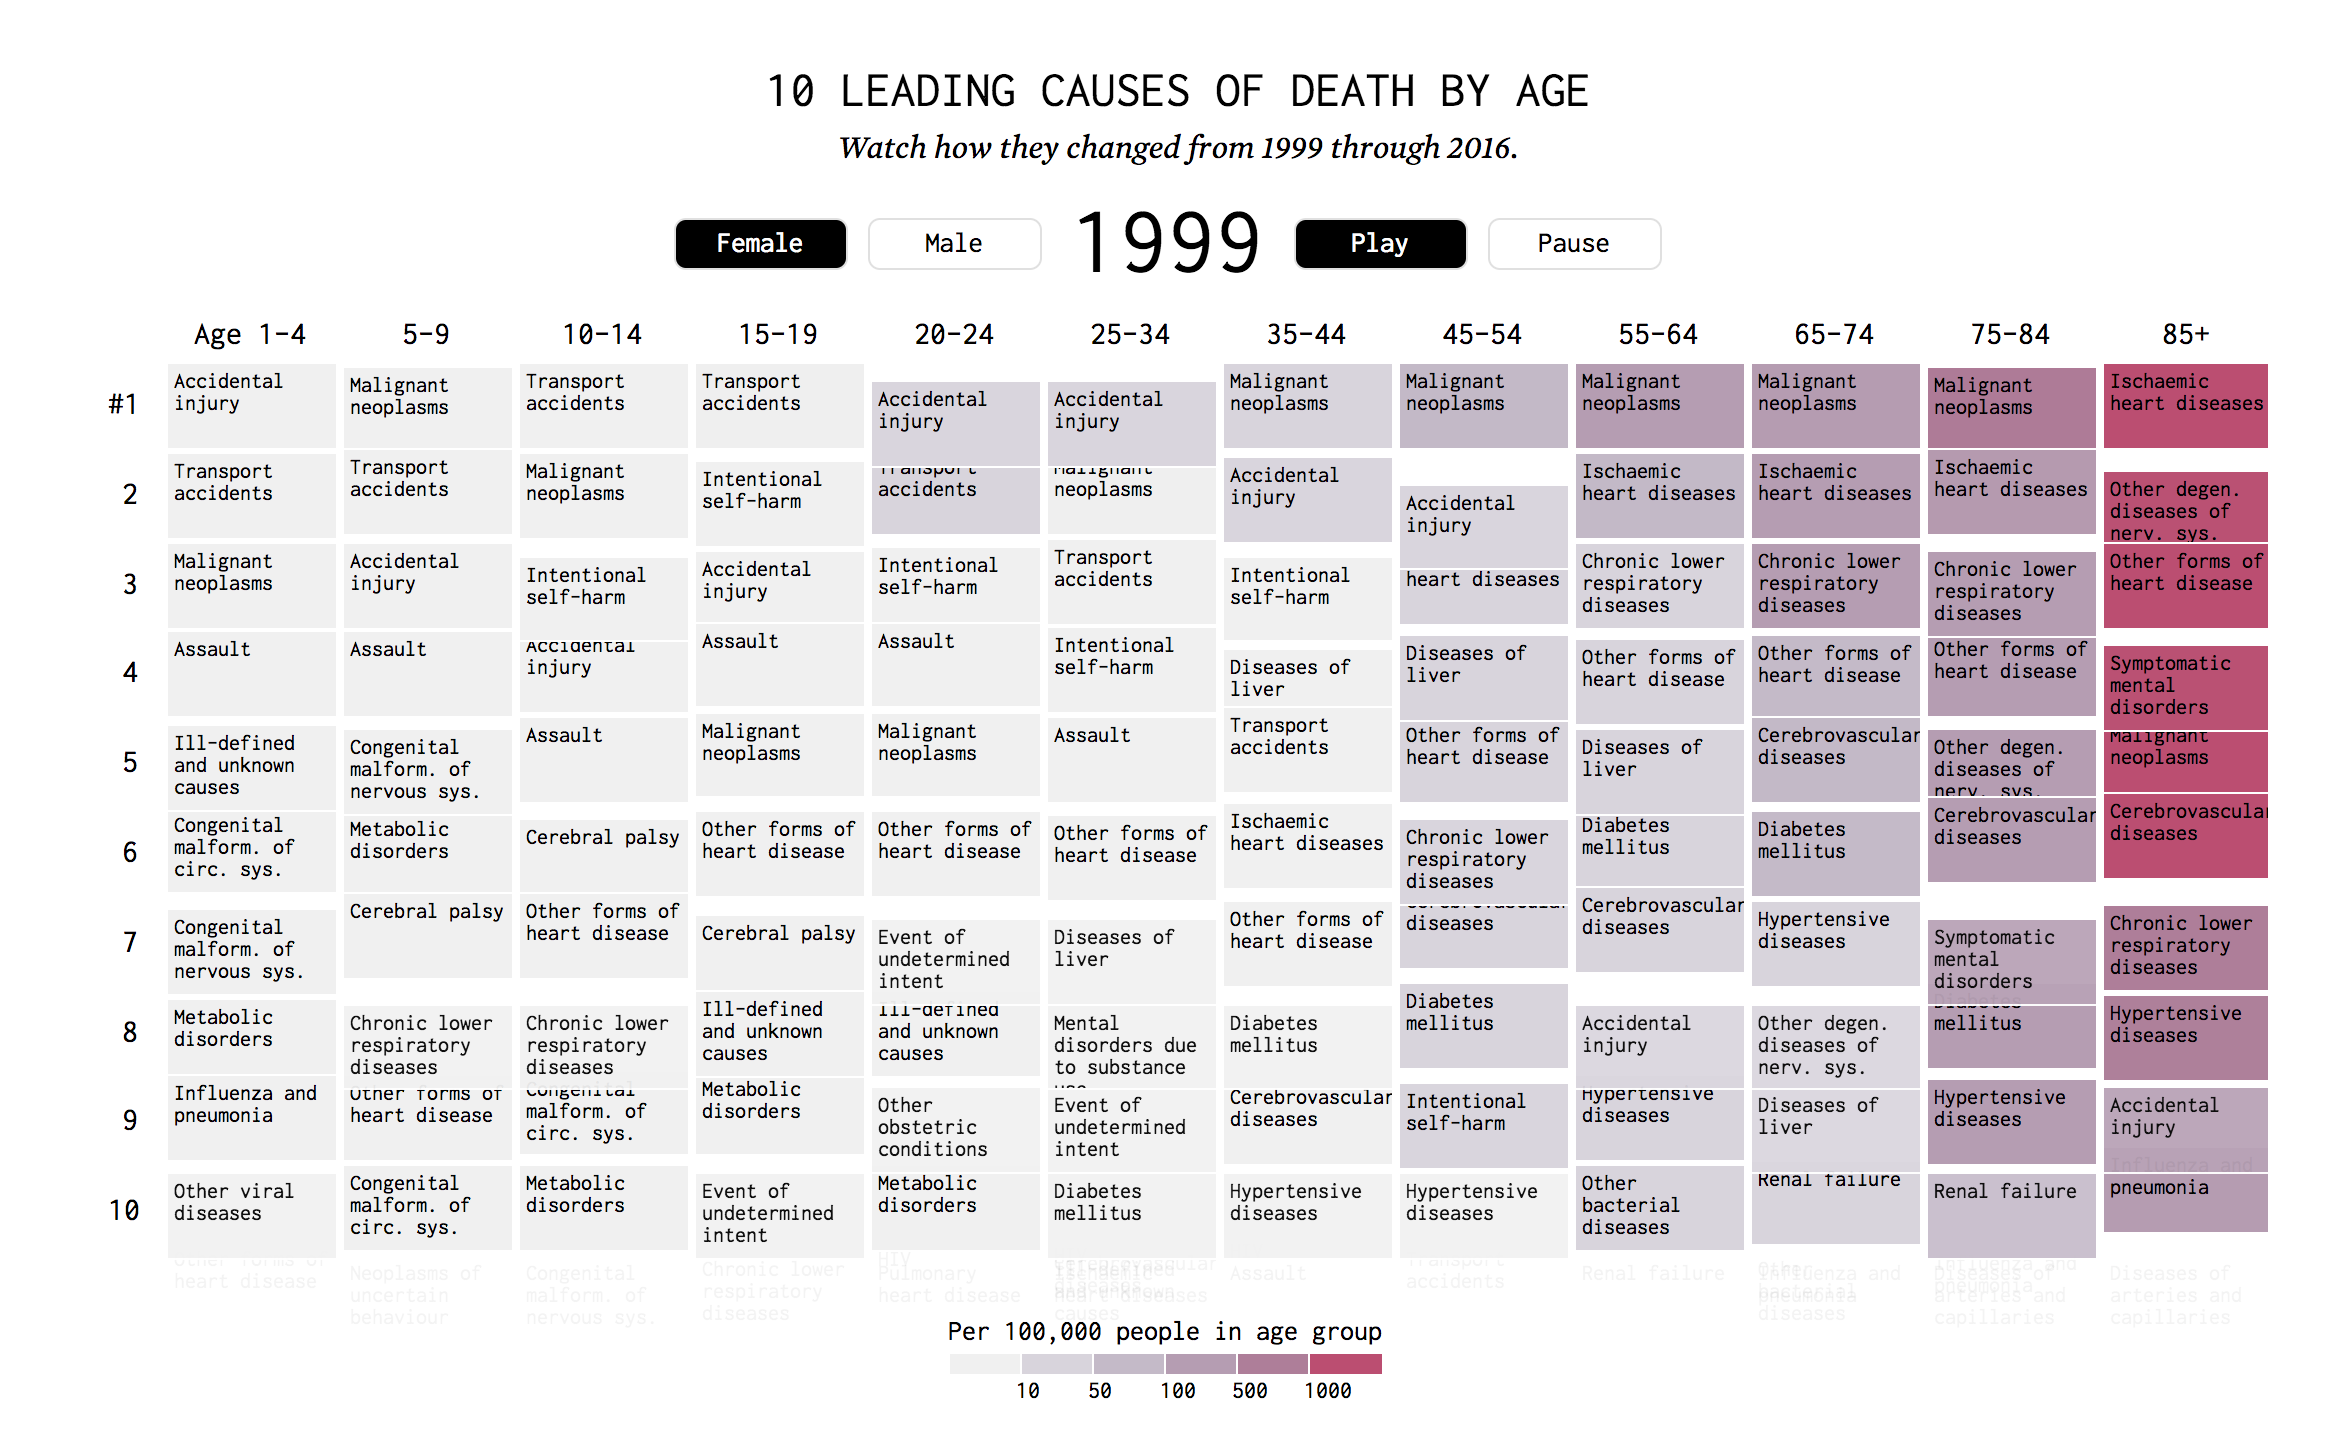
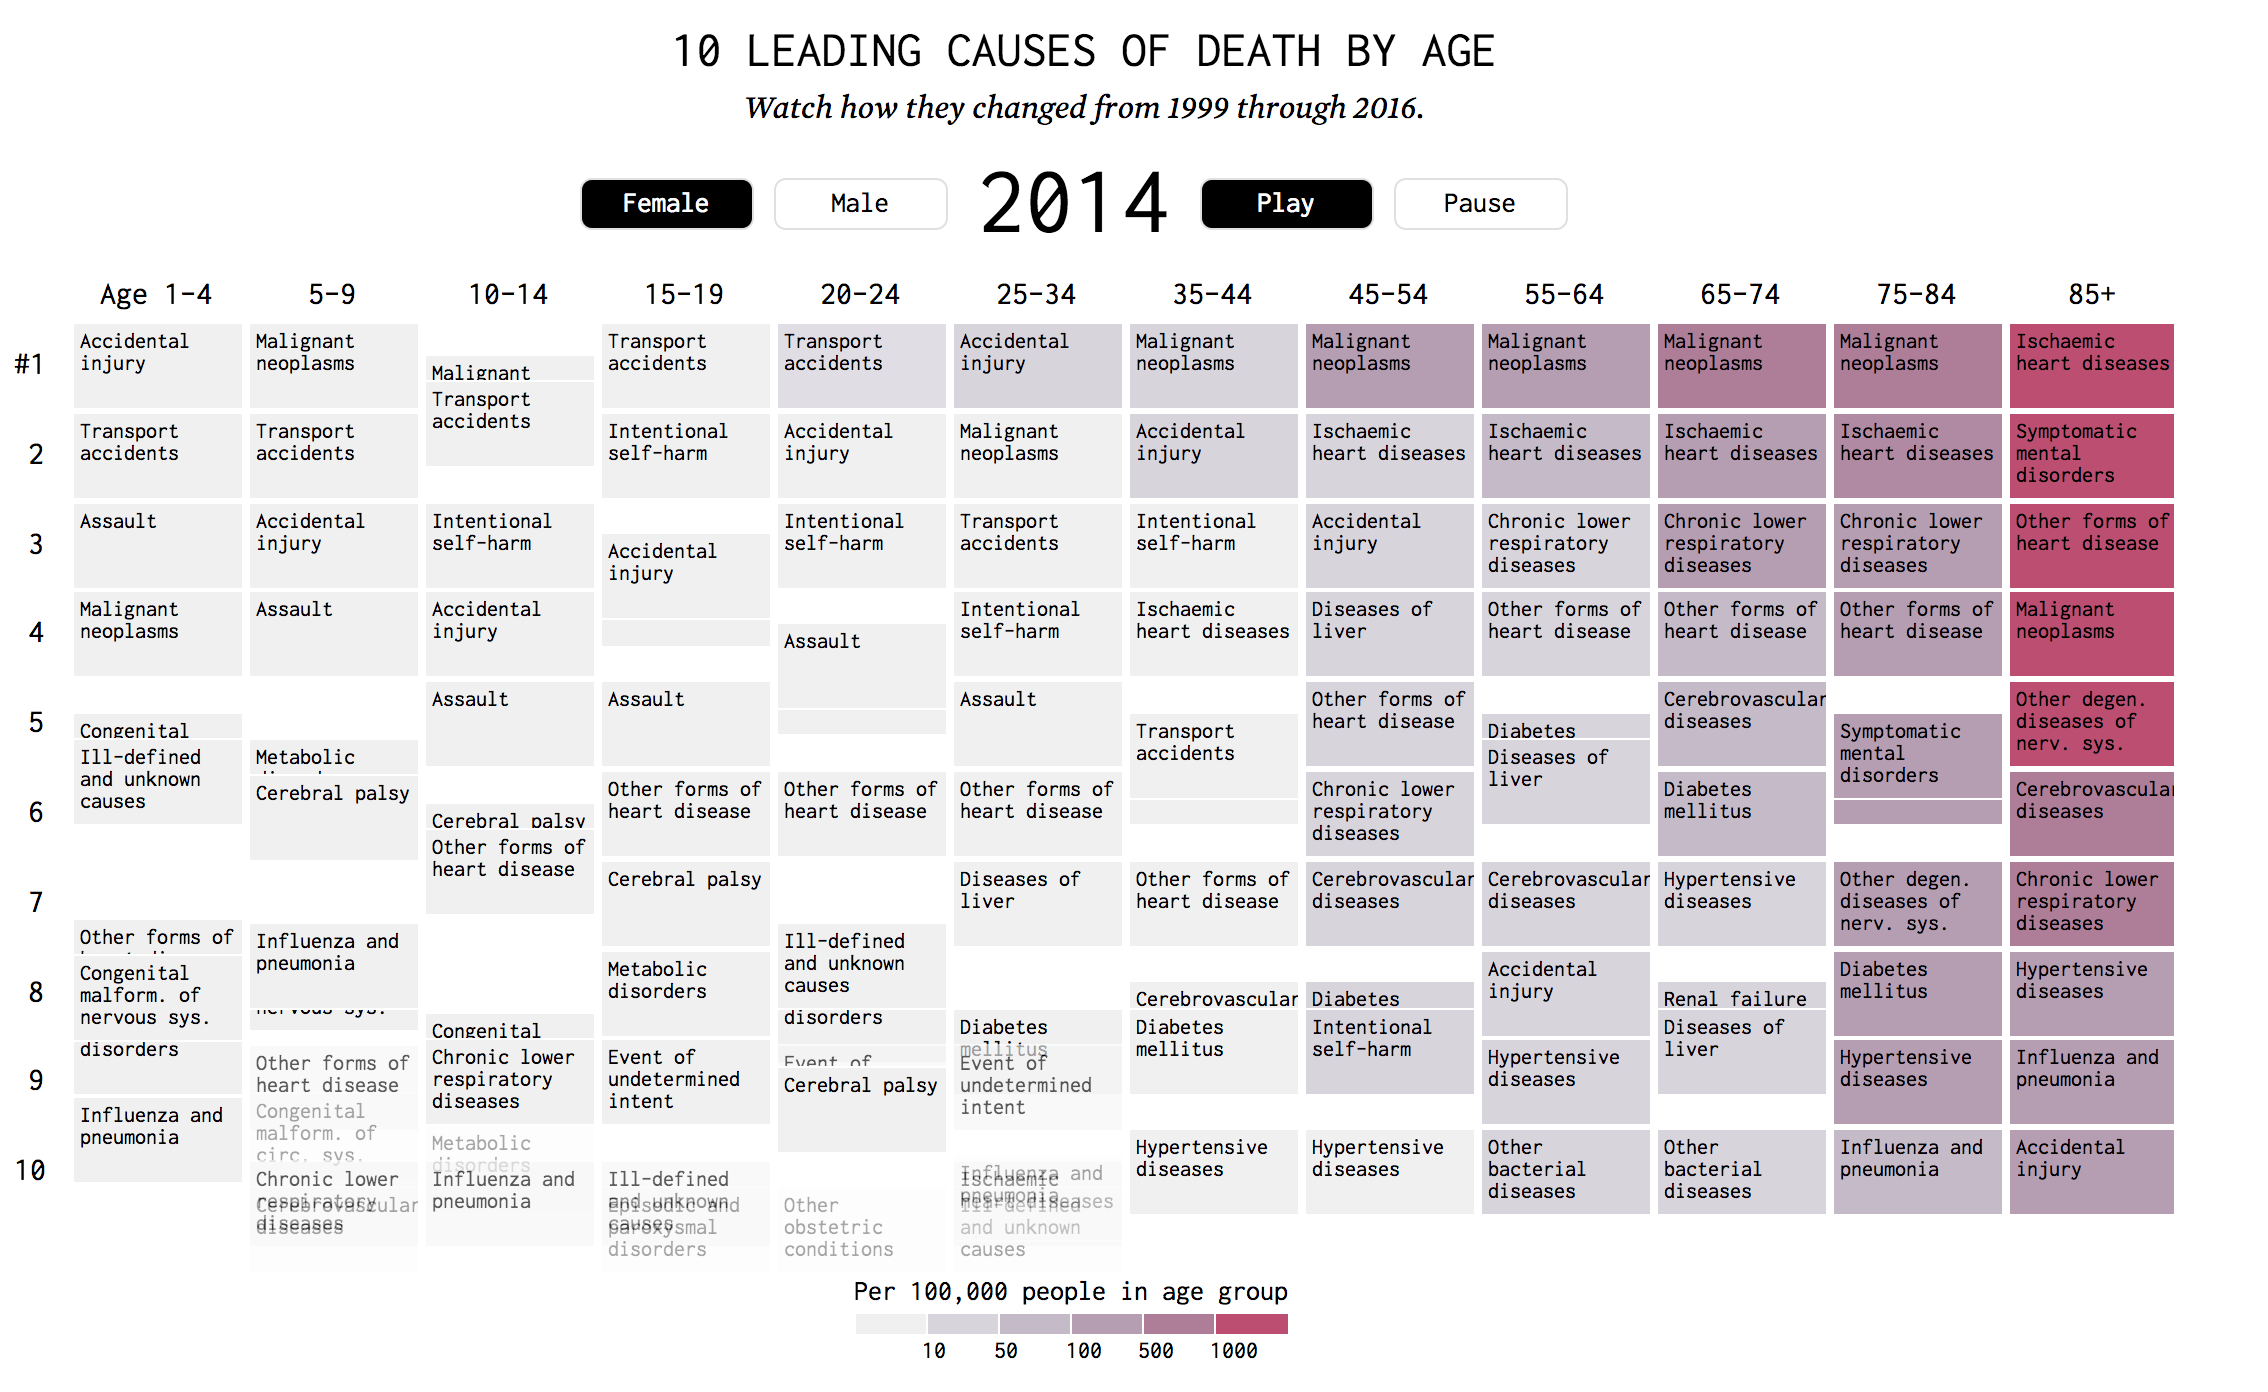
I figured that I would put the source first this time, because WordPress’s size limit makes it very difficult to read what’s in the infographic- also because the infographic is animated. This week’s project that I would like to discuss is a very interesting information visualization. The project involves columns of different age groups and shifting rectangles that detail the causes of death according to how common it is. The rectangles shift over time as the project moves through the years. I admire this project quite a bit because the artwork’s portrays vast amount of information in such a limited space and does it quite elegantly. I admire it because with the usage of the project, people will be able to see highly relevant information that is otherwise difficult to find out about.
As for the algorithm that generated this work, I assume that there is a counting variable that counts specific input from the vast data there is. Also, there would have to be another sorting algorithm that ranks the most common causes of death. Lastly, there would be a draw function that animates the data in an interesting way.
The creator’s artistic sensibilities manifested into the final form when he is able to display so many aspects and dimensions of data into a single format. The data that the work describes, age group, gender, time-line, usage of color to represent the rate within age group, and causes of death. I think that there is true mastery within such simplicity.

Min Jun Kim- Project 7 Curves

Try clicking and dragging!
sketch

/*
Min Jun Kim
minjunki@andrew.cmu.edu
15104-B
Project 7
*/

//This project draws a 3D model of spherial spiral

//how many points there are
var nPoints = 500;
//used for dragging
var dragging = false;

function setup() {
    createCanvas(480, 480, WEBGL);
    frameRate(100);
}


function draw() {
    background(0);
    // draw the frame
    stroke(255);
    noFill(); 
    rect(-width/2+3, -height/2+3, width-6, height-6); 
    //a circle that follows the mouse
    ellipse(mouseX-width/2,mouseY-height/2, 50,50);


    // draws the curve
    push();
    //rotate on z axis automatically, rotate x and y when clicked
    rotateZ(millis() / 8000);
    if (dragging == true) {
    	rotateX((mouseX-width/2) / 500);
	    rotateY((mouseY-height/2) / 500);
    }
    //calls drawing function.
    drawSphericalSpiral();
    pop();
}

//--------------------------------------------------
function drawSphericalSpiral() {
    // Spherical Spiral
    // http://mathworld.wolfram.com/SphericalSpiral.html
    //initialize points
    var x;
    var y;
    var z;
    //complexity depends on mouse
    var ph = mouseX / 10000.0;
    stroke(255);
    //transparent fill
    fill(255, 200, 200,3);
    beginShape();
    for (var i = 0; i < nPoints; i++) {
        var t = map(i, 0, nPoints, 0, TWO_PI);        
        x = 80*cos(i)/Math.pow(1+ph*ph*t*t,1/2);
        y = 80*sin(i)/Math.pow(1+ph*ph*t*t,1/2);
        z = 80*-ph*i/Math.pow(1+ph*ph*t*t,1/2);
        vertex(x, y, z);
    }
    endShape(CLOSE);
 	
}

function mousePressed() {
	dragging = true;
}

function mouseReleased() {
	dragging = false;
}

At first, I didn’t quite understand how to use mathematical functions to draw, but after messing around with the vertices, I learned the basics of it. I messed around with various functions, but I wanted to use a more complex curve. I then tried to implement a 3D function and the one that I liked the most was a spherical spiral. I thought that the shape was interesting in the drawings I found online. I realized that it doesn’t look exactly like that image I found online, which can possibly partly be attributed to the lack of negative values available in the functions, but I think that it still looks very interesting. The constant rotation made me dizzy so I implemented a dragging function so that it looks much simpler from one side. From the z axis, it looked like a regular circle so I made the coloring of it more transparent so that the planes are more see-through. I think the project turned out great and it taught me a lot about how to draw in javascript.

Here are some iterations where I was messing around with the numbers and variables in the function.

Process documentation 1.
Process documentation 2.

Min Jun Kim- Looking Outwards 6

According to the Laws of Chance by artist Jean Arp

The artwork that I would like to talk about today is from an artist named Jean Arp. This artwork is called According to the Laws of Chance, and it is made in the year 1933. The process of generating the art was dropping painted pieces of paper onto a surface. The idea is rather similar to that of Jackson Pollock’s drip painting, but this artwork dates back to before Pollack made his famous action paintings. The artist has other randomly generated art that is created in similar fashion, but the this particular artwork stood out to me.
What I admire about Arp’s art is that despite being randomly created, it is still on a rather subtle scale, where there aren’t too much clashing elements that compete for attention. The artist’s use of white space is what really gives this simple artwork the praise it deserves. The title really describes the artwork well, and I find the simplicity in the art to be very resembling of the design of nature.
Regarding the process, it is not a completely random piece of art. For one, the color of the paint was determined by the artist, and the number of the painted papers dropped was also in his control. The random aspects that go into the process are the shapes of the papers and where they are dropped.
The artist’s artistic sensibilities are manifested into the final form, when he is able to make deeply impactful pieces through the usage of randomness itself. Beauty is traditionally not attributed to randomness, but rather repetition and harmony, but Arp was able to tie the two together where randomness was used to create unsymmetrical yet harmonic piece.

Source: https://www.tate.org.uk/art/artworks/arp-according-to-the-laws-of-chance-t05005

Min Jun Kim- Project 6 Abstract Clock

sketch

/*
Min Jun Kim
minjunki@andrew.cmu.edu
15104-B
Project 6
*/

//this program displays an abstract clock

var x = 0;

function setup() {
    createCanvas(480, 400);
}

function draw() {
	background(0);
	var hours = hour();	//denotes hours of day
	var mins = minute(); //denotes minute of day
	var secs = second(); //denotes seconds of day
	
	//sets up such that it's not military time but standard
	if (hours > 12) {
		hours = hours - 12;
	}
	else if (hours == 0) {
		hours = 12;
	}
	

	//draws counter-clockwise rotating rectangles in background
	for (i = 0; i < 481; i+= 48) {
		for (v = 0; v < 480; v += 48) {
		push();
		fill(30);
		rectMode(CENTER);
		translate(i,v);
		rotate(2*PI*secs/60);
		rect(0,0,30,30);
		pop();
		}
		
	}
	
	//makes a cover so the clock is not disturbed
	fill(0);
	rect(width/7,30,width/1.4, height-65);

	
	//hour ring
	fill(200);
	//draws big arc in the back
	arc(width/2,height/2,width/1.3,height/1.3,
		-1/2*PI,2*PI*hours/12-1/2*PI);
	fill(0);
	//second arc gives gap between other types of arcs
	arc(width/2,height/2,width/1.3-100,height/1.3-100,
		-1/2*PI,2*PI*hours/12-1/2*PI);


	//minutes ring
	fill(100);
	//middle arc gives the minutes
	arc(width/2,height/2,width/2,height/2,
		-1/2*PI,2*PI*mins/60-1/2*PI)
	fill(0);
	//second arc gives gap between other types of arcs
	arc(width/2,height/2,width/3,height/3,
		-1/2*PI,2*PI*mins/60-1/2*PI);

	//seconds ring
	fill(50);
	//draws small arc in middle
	arc(width/2,height/2,width/3-10,height/3-10,
		-1/2*PI,2*PI*secs/60-1/2*PI);
	fill(0);
	//second arc allows the arc to get a more distinct shape
	arc(width/2,height/2,width/5,height/5,
		-1/2*PI,2*PI*secs/60-1/2*PI);

	fill(0);
	//covers the track
	ellipse(width/2,height/2,70,70);
}

This project made me dig deep into the concept of time and how time came to be represented over time. In the past we had sun-dials and no moving parts. Over time we developed physical mechanical clocks, and nowadays we use digital numbers mostly. I found it interesting in this project we are going from a more digitized type of time-showing into a more archaic and less optimal way of displaying time. These below are the ideas that I generated when I was brainstorming.

Ideas for abstract clock

I had a lot more ideas but I found were impractical and very difficult to code. Initially I wanted to emulate the light clock from physics with a bouncing ball, but I realized it would be impractical to display how much time has passed. I ended up choosing the designs for an arc-based clock, with different sizes throughout. Calibrating the clock to match the time was rather difficult at first, but once I figured it out the rest was easy. I added some decorations in the background to make the project more exciting. All in all, I think this project was fun because there was so much possibilities.

Min Jun Kim- Looking Outwards 5


This is the scene from Dr.Strange that I thought was the most interesting out of CG effects. It is the open your eyes scene from Dr. Strange.

The 3D computer graphics project that stood out to me the most is the scene from the movie Dr. Strange. I thought that this scene was immensely visibly engaging and incorporates so many different elements, such as entities and even a butterfly. What I admire the most of it is simply how realistic it is and how it sucks the audience into a whole new reality. By referencing what we are familiar with, such as the planet Earth and a butterfly, we are able to see just how surreal the experience is. The point of CG typically is to make untrue things seem as realistic as possible, but with this project, its goal was the opposite- to make things seem bizarre as possible but with such technological skills to make the surreal look realistic and blend well with the actor himself. I admire these aspects because it is something so different and unique and at the same time memorable.
I think that the algorithms that were used to generate these scenes definitely used 3D algorithms like camera to make things more 3D. I also think that they used scale and translate in the parts where locations are being zoomed out, while the characters stay in the same place. The must have also used recursion because there were a lot of recurring elements when Dr. Strange is in the different dimensions.
The director’s artistic sensibilities manifested in the final form when he was able to tell such a compelling story with the crazy graphics. He used a voiceover to explain what is going on in the scene and how it relates to the story. Doing so anchors the intense and out-worldly CG into a rock-hard reality in the story and doesn’t confuse the audience but rather teaches them. I think that this particular scene sets up the story of the whole movie very well.

Source:
Movie: Dr. Strange
Director: Mads Mikkelsen
Actor in scene: Benedict Cumberbatch

Min Jun Kim- Project 5 Wallpaper

sketch

/*
Min Jun Kim
minjunki@andrew.cmu.edu
15104-B
Project 5
*/

function setup() {
    createCanvas(480, 400);

}

function draw() {

	noStroke();
	background(161,211,234);
	fill(250,250,200,220);
	//moves the whole position up past left top corner
	translate(-10,-20);

	//draws the grass lines, triangles and icecream tops
	for (var j = 0; j < height+30; j += 60) {
		for (var h = 0; h < width+30; h += 80) {
			push();
			//makes the triangles and the dashes
			fill(200,180,100);
			translate(h+12,j+10);
			triangle(10,28,30,28,20,55);
			fill(100,180,100);
			text("///", -22, 0);
			pop();
			

			push();
			//makes more dashes colored differently and calls icecream function
			translate(h+12,j+10);
			rotate(-1);
			text("///", -22, 0);
			pop();
			drawn(h,j+0.5);


		}
	}

}

function drawn(e,f) {
	push();
	//calls the drawIt function to add more complexity to it
	for (var z = 0; z < 10; z+=1) {
		translate(e,f);
		drawIt(25, -30);
		

	}
	pop();
}


function drawIt(a,b) {
	push();
	translate(a,b);
	//colors it pink
	fill(251,156,180);
	for (var x = 0; x < 8; x+= 1) {
		//draws ellipses while constantly scaling and translating
		translate(x+1,5);
		scale(0.45,-0.7);
		ellipse(x+15,10,60,43);
	}
	pop();
	
}


I wanted to see if I can create unique patterns just by drawing one ellipse, so I messed around with using for loops on scale and translate and came across very unique patterns. First it came out as a thin feather and when I input a negative value in the scale in came out with a very unique and deformed sort of pattern. I thought that it looked a lot like an icecream so I incorporated other elements to make it look more alike and added more patterns to make the wallpaper interesting. Below are other iterations of this project that I’ve made but didn’t feel like elaborating on.

Peacock wallpaper that didn’t end up in final iteration.
Lightbulb iteration that I didn’t elaborate on.

I thought that it was very interesting how just making minor tweaks in the iteration can change the picture as a whole. I thought that this project helped me learn more about calling functions in functions.

Min Jun Kim- Looking Outwards 4


This is a descriptive video explaining Christina Kubisch’s series of art installations involving sound

The project is art installations with an immersive experience where an audience can walk around wires and technology through space with headphones to listen to various and creative sounds that can be heard through the headphones. The theory behind this working is electromagnetic induction where fields are disrupted when electrical objects move near each other. I admire that this project involves discovery as well as a creative process. Kubisch was able to discover a phenomenon through curiosity and then applied creative process to turn it into an art where everyone can experience. I thought that this project was very unique and innovative in that it’s not really a known category of art- especially at the time that it was discovered. I admire these aspects because I’ve sometimes felt as if the boundaries of art are limited, and that we are limited by the tools that we have at hand, whether it be a paintbrush or styrofoam, but with discovery we are able to expand the boundaries of art far beyond what is it now. I suppose that the magnets that shake within the headphones are processed by the algorithms and then turned into sound data which is what the user hears. The creators artistic sensibilities are manifested into final forms when she designs various electrical constructs that allows users to experience various sounds generated by them. I think that with the broadness of technology there are so many directions that can be taken with this type of art.

source: https://www.sfmoma.org/christina-kubisch-discovering-new-sounds/

Min Jun Kim -Project 4 String Art

sketch

/*
Min Jun Kim
minjunki@andrew.cmu.edu
15104-B
Project 4
*/

function setup() {
    createCanvas(400, 300);
}

function draw() {
	background(0);
	//Thickness of Strokes of points
	strokeWeight(0.5);
	//color of strokes
	stroke(100,150,150);
	translate(width/2,height/2);
	rotate(3.95);

	for (var i = 0; i<500; i += 19) {
		//first large oval sideways settings
		var x = 140*sin(i);
		var y = 100*cos(i);
		//small circle settings in middle
		var eye1x = 50*sin(i*2);
		var eye1y = 50*cos(i*2);
		//draws the points outline for all drawn shapes
		point(x,y);
		point(y,x);
		point(eye1x,eye1y);
		
		//draws the lines on the vertial line
		for (var v = -200; v<201; v += 50) {
			stroke(100,150,150);
			line(-200,v,x,y);
			line(200,v,x,y);	
		} 
		//draws the lines on the horizontal line
		for (var f = -200; f<201; f += 50) {
			line(f,-200,y,x);
			line(f,200,y,x);
			//draws lines starting from middle to the small circle
			line(0,0,eye1x,eye1y);
			line(0,0,eye1x,eye1y);
		}
		
	}
}


I started off by drawing some points using the “for” loops. I used sine and cosine to draw points along circles. This helped me visualized where the lines will go. I then used nested “for” loops to draw the lines. The lines went along all sides of the canvas and I thought that it looked well. I was messing around with the variables and the end result turned out to be an upside-down tilted heart. I then translated to the middle of the canvas in order to rotate it, then converted all the variables to scale properly. All in all, I thought the project really taught me how to use for loops.

Min Jun Kim- Looking Outwards 3

Artwork by Torolf Sauermann.

This week’s topic is about computational fabrication. While doing some research, I came across an artist by the name of Torolf Sauermann. He creates a lot of unique sculptures that have been 3D printed as the ones shown above. He creates fascinatingly impossible figures that probably couldn’t be constructed by a human alone. What I admire the most about his artwork is that it endlessly pushes the boundaries of the 3D world. The artwork presented above has the characteristics of a Möbius strip which is a ring that only has one side. I admire the fact at how intricate it is and how insanely difficult it would be to create without the usage of a 3d printer.
As for how it was generated, I think that it was definitely modeled by a 3d rendering software. I assume that he had a simpler version of the model, like a skeleton or some lines, that were filled in and made more intricate over time through the usage of algorithms. I think the artist’s genius to create such forms in his mind simply manifested into material form.

Below are some of his other artworks:

Another artwork by sauermann

sauermann.

Some links to the sources of the art found online:
http://www.evolution-of-genius.de/gallery/default1.htm
https://imaginary.org/users/torolf-sauermann
https://viz.arch.tamu.edu/

Min Jun Kim -Project 3 Dynamic Drawing Section B

sketch

/*
Min Jun Kim
minjunki@andrew.cmu.edu
15104-B
Project 3
*/

function setup() {
    createCanvas(640, 480);
}

function draw() {

	//set up and first quad 
	strokeWeight(3);
	push();
	background(mouseX);
	translate(width/2,height/2);
	rotate(mouseX/-100);
	drawQuad();
	pop();

	//the oval representing the eye
	push();
	fill(mouseX);
	translate(width/2,height/2)
	ellipse(0,0,mouseX*1.9,mouseX*1.3)
	pop();

	//red circle in middle
	push();
	translate(width/2,height/2);
	fill(mouseX*255/640,10,10);
	ellipse(0,0,mouseX,mouseX);
	pop();

	//a ring around the spinning reverse quads
	push();
	translate(width/2,height/2);
	fill(mouseX*255/640,10,10)
	ellipse(0,0,mouseX/1.3,mouseX/1.3);
	pop();

	//quad 2	
	translate(width/2,height/2);
	push();
	fill(0);
	rotate(mouseX/-300);
	quad(-mouseX/3,0,0,mouseX/3,mouseX/3,0,0,-mouseX/3)
	pop();

	//quad 3
	push();
	fill(mouseX*255/640,10,10)
	rotate(mouseX/-400);
	quad(-mouseX/4,0,0,mouseX/4,mouseX/4,0,0,-mouseX/4)
	pop();

	//quad 4
	push();
	fill(0);
	rotate(mouseX/-500);
	quad(-mouseX/5,0,0,mouseX/5,mouseX/5,0,0,-mouseX/5)
	pop();

	//quad 5
	push();
	fill(mouseX*255/640,10,10)
	rotate(mouseX/-600);
	quad(-mouseX/6,0,0,mouseX/6,mouseX/6,0,0,-mouseX/6);
	pop();

	//quad 6
	push();
	fill(0);
	rotate(mouseX/-700);
	quad(-mouseX/7,0,0,mouseX/7,mouseX/7,0,0,-mouseX/7);
	pop();

	//spinning rect 1
	push();
	fill(0);
	rotate(mouseX/30-0.4);
	rect(mouseX/4,mouseX/4,mouseX/20,mouseX/20);
	pop();

	//spinning rect 2
	push();
	fill(0);
	rotate(mouseX/30+1.6);
	rect(mouseX/4,mouseX/4,mouseX/20,mouseX/20)
	pop();

	//spinning rect 3
	push();
	fill(0);
	rotate(mouseX/30-2.5);
	rect(mouseX/4,mouseX/4,mouseX/20,mouseX/20)
	pop();

	//upper black cover
	push();
	fill(1);
	noStroke();
	rect(-400,-100+mouseX*2,1000,1000);
	pop();

	//lower black cover
	push();
	noStroke();
	fill(1);
	rect(-400,-200-mouseX*2,800,300)
	pop();


}

//function that draws quads
function drawQuad() {
	quad(-mouseX/2,0,0,mouseX/2,mouseX/2,0,0,-mouseX/2);
	
}


The project is based on dynamically drawing when mouse is moved across the horizontal axis (mouseX).
The process was rather simple and started with me messing around with the rotate function. I was rotating a quad and I thought that overlaying the quad with multiple quads would look pretty cool. I initially tried to call the drawQuad function that I made to create multiple quads, but I quickly learned that doing so will make identical quads and so I had to manually create multiple quads in the middle by differing the speed at which it grows. The manual process however became a lot easier once I learned about the Push() and Pop() on this week’s readings. After creating multiple rotating quads in the middle I realized the it reminded me of the sharingan from Naruto and went along with it to create something that somewhat resembles it. I ended up manipulating size, position, angle, color and speed.
All in all, I had a lot of fun figuring things out for this project.