![[OLD FALL 2018] 15-104 • Introduction to Computing for Creative Practice](https://courses.ideate.cmu.edu/15-104/f2018/wp-content/uploads/2020/08/stop-banner.png)
var img;
var x = 0;
var y = 0;
var circle = 20;
var dirX = 1;
var dirY = 1;
function preload() {
img = loadImage("https://i.imgur.com/YA5ZxuZ.jpg");
}
function setup() {
createCanvas(391, 480);
imageMode(CENTER);
noStroke();
background(255);
img.loadPixels();
}
function draw() {
var pix = img.get(x, y); //gets color of pixel at location x,y
fill(pix); //fills circle with that color
ellipse(x, y, circle, circle); //draws circle
x+=random(10) * dirX; //sets horizontal wobbly direction for traveling "snake"
y+=random(10) * dirY; //sets vertical wobbly direction for traveling "snake"
//code below: if snake goes out of bounds in canvas
//then restart in a random location
//with new snake size and reversed direction
if (x > width || x < 0) {
x=floor(random(width));
circle=random(10,25);
dirX = -dirX;
}
if (y > height || y < 0) {
y=floor(random(height));
circle=random(10,25);
dirY = -dirY;
}
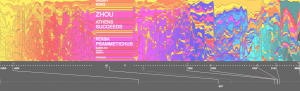
}I enjoyed this project quite a bit. I chose to go the narcissistic route and make a self-portrait, mostly because I recently painted my apartment and took this selfie against the new wall, and I really like the color palette of this photo.
I started with the pointillism example for reference, but I knew I wanted to make a portrait that gradually filled in with moving lines, rather than random dots/points. What ended up emerging was this kind of “snake” made up of circles moving across the canvas.
Here’s the original photo: