Rachel Lee Project 07 Section E

sketch

/* Rachel Lee
Section E
rwlee@andrew.cmu.edu
Project 07: Curves */

function setup() {
    createCanvas(500, 500);
}

function draw() {
    background(150, 200, 170);
    strokeWeight(1);
    fill(255);
	drawHypothrochoid();
}

function drawHypothrochoid() {
	// radius of circle a changes with mouseX within bounds
	var a = constrain(mouseX, 0, width / 3.5); 
	// radius of circle b
	var b = 10; 
	// distance from center of interior circle changes with mouseY
	var h = map(mouseY, 0, height / 5, height / 2, height / 4); 

    // t considers all values in a circle (360 degrees)
    for (var t = 0; t < 360; t ++) { 
    	// hypotrochoid equations affecting x and y (parametric equations)
        var x = width / 2 + (a - b) * cos(radians(t)) + h * cos(((a - b) / b)) * (radians(t)); 
        var y = height / 2 + (a - b) * sin(radians(t)) - h * sin(((a - b) / b) * (radians(t))); 
        // drawing hypothrochoid inspired ellipse
        ellipse(x, y, 5, 5);
    }

    // color of elements change depending on mouseY position
    if (mouseY <= height / 2) {
        stroke(247, 138, 100);
    } else if (mouseY > height / 2) {
    	stroke(170, 160, 200);
    }
}

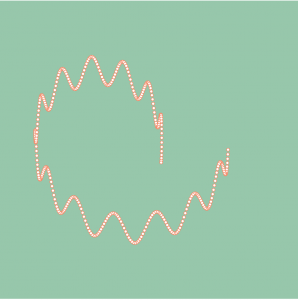
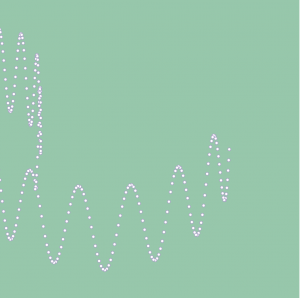
For this project, I was inspired by the curves of the Hypotrochoid. I really enjoyed the curves that were being created in by the two simultaneous circles operating at once, and decided to add interaction to alter the tightness of the coils and play around with three dimensionality in space. While this project was initially challenging, I found it really fun to see what kind of results the curve would program.

Example of tighter coiled curve
Example of looser coiled curve

Rachel Lee Looking Outwards 07 Section E

Artscope
Screen capture of Stamen’s SFMoMA Artscope (2009).

This week, the project I have chosen to explore is SFMoMA Artscope, an informational visualisation project created by Stamen. What I admire the most about this project is that it challenged my perception of what a map looks like– typically, I would think that a map would communicate information about a physical space, but what I found very interesting about this project is how it is mapping a collection of work irrespective of space, and arranging SFMoMA’s archive by acquisition date. Furthermore, I admire the fact that this project might allow people who do not have the oppurtunity to visit the museum to access the collection online, adding an element of inclusivity. Stamen built this project using their Modest Maps library, which is an open source toolkit that allows their designers and developers to quickly put together maps, specifically, maps that zoom and pan. I think Stamen was able to play around with artistic sensibilities, in conjunction with the brand of SFMoMA just by creating the map. This data visualisation tactic makes the artwork thumbnails seem almost collage like, and creates a bold visual language.


Rachel Lee Project 06 Section E

sketch

/* Rachel Lee
Section E
rwlee@andrew.cmu.edu
Project 06: Abstract Clock */

var tx = []; // flower x position array
var ty = []; // flower y position array

function setup() {
    createCanvas(400, 400);
    angleMode(DEGREES);

    var sec = second();
    var min = minute();
    var hr = hour();

// randomize position of flowers
    for (i = 0; i < 60; i ++) {
        tx[i] = random(85, 270);
        ty[i] = random(65, 260);
    }
}

function draw() {
	background(160, 190, 105);
	noStroke();
    
    var sec = second();
    var min = minute();
    var hr = hour();
	

// pond
	fill(160, 155, 160);
	ellipse(180, 170, 305, 305);
	
// color of pond water changes according to minute time bracket
	if (min >= 0 & min <= 20) {
		fill(65, 150, 150);
		ellipse(180, 170, 270, 270);
	} else if (min > 20 & min <= 40) {
		fill(65, 130, 180);
		ellipse(180, 170, 270, 270);
	} else if (min > 40 & min <= 60) {
		fill(65, 170, 130);
		ellipse(180, 170, 270, 270);
	}	
    
// pebbles
    fill(145, 140, 145);
	ellipse(285, 285, 50, 60);
	fill(105, 100, 105);
	ellipse(310, 245, 35, 30);
	fill(200);
	ellipse(270, 285, 35, 30);
	fill(150);
	ellipse(245, 300, 35, 35);
	fill(220);
	ellipse(290, 255, 20, 20);	

// tiny flowers: corresponds to seconds
    for (i = 0; i < sec; i ++) {
        fill(235, 105, 45);
        ellipse(tx[i], ty[i], 5, 5);
    }

// lilypads
    	fill(100, 140, 55);
    	ellipse(95, 183, 55, 40);
    	ellipse(155, 253, 55, 50);
    	ellipse(205, 100, 70, 60);
    	fill(125, 160, 60);
    	ellipse(95, 180, 55, 40);
    	ellipse(155, 250, 55, 50);
    	ellipse(205, 95, 70, 60);
	    fill(65, 150, 150);

// changing little lilypad wedge color according to pond water color
    	if (min >= 0 & min <= 20) {
		    fill(65, 150, 150);
		    triangle(125, 170, 95, 180, 125, 180);
		    triangle(175, 230, 145, 260, 205, 230);
		    triangle(215, 90, 240, 70, 245, 90);
	    } else if (min > 20 & min <= 40) {
		    fill(65, 130, 180);
		    triangle(125, 170, 95, 180, 125, 180);
		    triangle(175, 230, 145, 260, 205, 230);
		    triangle(215, 90, 240, 70, 245, 90);
	    } else if (min > 40 & min <= 60) {
		    fill(65, 170, 130);
		    triangle(125, 170, 95, 180, 125, 180);
            triangle(175, 230, 145, 260, 205, 230);
		    triangle(215, 90, 240, 70, 245, 90);
	    }	
    
// firefly: moves according to hour
    push();
    noStroke();
    translate(width / 2.3, height / 2.5);
    rotate(360 / 60 * hr);
    fill(242);
    ellipse(-20, -40, 55, 20);
    ellipse(20, -40, 55, 20);
    fill(255);
    ellipse(-20, -45, 55, 20);
    ellipse(20, -45, 55, 20);
    stroke(240, 215, 70);
    strokeCap(ROUND);
    strokeWeight(20);
    line(0, 0, 0, -65);
    fill(0);
    noStroke();
    ellipse(-10, -60, 7, 7);
    ellipse(10, -60, 7, 7);
    pop();
}

I really enjoy being in nature, so for my project wanted to imitate a scene I saw during a hike this summer. On my abstract clock, the dragonfly’s position represents the hour, the color of the pond water changes based on a particular range of minutes, and the number of orange ‘flowers’ represent seconds. This project was a little challenging, but rewarding to complete. I am very happy with how it turned out.

Initial sketch

Rachel Lee- Looking Outwards 06- Section E

This week, I have decided to explore the generative art of artist and creative coder Matt Deslauriers. In the particular experiment I am investigating Deslauriers has decided to depict a ‘seed’ that is randomly generated using simplex noises to render the particle’s size, position, scale, noise and velocity. As the artwork uses Node.js and Canvas to output frames as mp4 videos, when the user clicks the frame, the seed characteristics and background color is further randomised. I really admire and am impressed by Deslauriers’ generative art experiment because he managed to think every element through very carefully, despite having a limited degree of control over a randomised composition. For example, in order to achieve color contrast between each frame, he used a module by another developer to ensure legibility of text on background color and visual harmony between elements, demonstrating his acute attention to detail. Overall, I think each composition is very beautiful, and the artist was able to demonstrate his artistic sensibilities by investigating contrasts, the shape of the strokes the underlying framework which the generative strokes follow (e.g. grid, circular, hexagonal).

screen1
A still from Deslaurier’s generative piece (2016)


Rachel Lee Project 05 Section E

sketch

/* Rachel Lee
Section E
rwlee@andrew.cmu.edu
Project 05
*/


var spacing = 80; // spacing between elements
var kiwiSize = 60;

function setup() {
    createCanvas(480, 480);
    background(255, 210, 225);

    // drawing kiwi
    for (var x = 75; x < width - 75; x += spacing) { // width of rows
        for (var y = 85; y < height - 85; y += spacing * 1.2) { // length of columns
            noStroke();
     // brown kiwi skin
            fill(165, 115, 65);
            ellipse(x, y, kiwiSize, kiwiSize);
   
    // green kiwi flesh
            fill(190, 215, 90);
            ellipse(x, y, kiwiSize * 0.9, kiwiSize * 0.9);

    // beige kiwi core
            fill(240, 240, 205);
            ellipse(x, y, kiwiSize * 0.5, kiwiSize * 0.5);
    
    // kiwi seeds
            fill(0);
            ellipse(x - 15, y, 3, 3);
            ellipse(x + 15, y, 3, 3);
            ellipse(x, y - 15, 3, 3);
            ellipse(x, y + 15, 3, 3);
        }
    } 

    // text that aligns with kiwi
    for (var a = 45; a < width - 75; a += spacing) {
    	for (var b = 105; b < height - 85; b += spacing * 0.9) {
            fill(40, 140, 70);
            textSize(9);
            textFont('Akkurat Mono');
            text("kiwi dreams", a, b * 1.3);    
    	}
    }
    noLoop(); // drawing only once
}


function draw() {

}


I decided to base my wallpaper on my current favourite fruit, the kiwi. I wanted to incorporate more playful colors as well as a dreamier caption, since it is turning cold in Pittsburgh and I miss warm weather. I was inspired by a cherry printed shirt I came across when I was online shopping, and numerous fruit illustrations I found on Pinterest (such as this pomegranate one). Overall, it was really fun playing with symmetry and pattern, and I would like to continue this project to perhaps feature alternating sliced and whole kiwis.

Pomegranate pattern I took inspiration from
Cherry shirt I came across when online shopping

Rachel Lee- Looking Outwards 05- Section E

Michael Theodore’s robotic scratchboard drawings was a project done in collaboration with engineers at the Boulder Engineering Studio. The artists created and programmed a robotic arm via code to etch unique line and pattern formations of black ink into white clay. I really admire how Theodore was able to emulate the gestural and whimsical quality of hand drawing, without having mechanically generated drawings appear as too stiff, and even taking the potential of 3D drawing further than the human hand could produce via texture, pattern and rhythm. I think that Theodore was able to effectively use technology to push the boundaries of his own thematic interests (the human perceptual experience), by harnessing the capabilities of robotics to depict sensitivities and intricacies. Further, the artist’s sensibilities are evident based on the density and thickness of strokes, which create dynamism and movement within the composition.

84929.78469 by Michael Theodore and Boulder Engineering Studio (2014)


Rachel Lee- Project 04- String Art- Section E

sketch

/* Rachel Lee
Section E
rwlee@andrew.cmu.edu
Project- 04: String Art 
*/

// global variables 
var increment = 10; // spacing between different line segments

function setup() {
    createCanvas(400, 300);
    background(250, 155, 130);
}

function draw() {
	strokeWeight(random (0.3, 1)); //randomizes stroke weights within 
	//curve and 'grid' elements (vertical and horizontal inner mesh layer)

// top right swoop
    for (var a = 0; a < width; a += increment) {
        stroke(240, 200, 90);
        strokeWeight;
        line(a, 0, width, a);
	}

// bottom left swoop
    for (var b = 0; b < height; b += increment) {
   	    stroke(160, 190, 225);
   	    strokeWeight;
   	    line(b, height, 0, b); 
   }

// inner mesh layer top right 
    for (var c = 50; c < width; c += increment) { //curve starts at 50 pixels across screen
    	stroke(150, 200, 200);
    	strokeWeight;
    	line(c, 0, 300, c); //curve begins to taper at 300 pixels (width) 
    } 

// inner mesh layer bottom left
    for (var d = 50; d < height; d += increment) { // starts 50 pixels down left side of screen
        stroke(150, 215, 120);
        strokeWeight;
        line(0, d, d, height); 
    } 

// vertical inner mesh layer
    for (var d = 80; d < height; d += increment) { 
        stroke(215, 215, 120);
        strokeWeight;
        line(d, 0, d, height); // lines begin at 80 pixels from left side of screen
    } 

// horizontal inner mesh layer
    for (var e = 0; e < width; e += increment) {
    	stroke(210, 205, 80);
    	strokeWeight;
    	line(0, e, width, e);
    }

}

For my String Art project, I was inspired by one of my favourite artists, Naum Gabo. I initially based my piece on his sculpture Linear Construction No. 1, but decided to add my own flair with color, and vary the types of shapes that were layered in the inner ‘mesh’ panels. While challenging, this project was really fun to experiment with– I especially liked seeing how randomising the stroke weight affected the dynamics of the piece.

Rachel Lee Looking Outwards 04 Section E

Sonic Playground by Yuri Suzaki Design and High Atlanta (2018)

The project I have chosen to write about is Sonic Playground by Yuri Suzaki Design with High Atlanta. I admire this project because of its interactive quality, and how it engages the public in an immersive experience based on their own personal input (manipulating the sounds they are making via various processes). I think this creates an intimate relationship between the user and the artwork, and invites them to be curious and explore it piece. The creators of this piece created algorithms via a raytracing tool. This tool allowed users to pick a sound source of their choice, and relay that sound in a specified direction, or towards the shape of the mirrors of bell at the start and end of the pipes. The result of these algorithms includes sound that envelopes those interacting with the piece, and lateral reflections. I think that the creator’s artistic sensibilities manifested in the final form via the bright colors of the sound sculptures, and the shape and direction in which the ‘speakers’ point– this allows for a playfulness in not only form, but also in sound that has the potential to evoke strong emotions of joy and wonder in those interacting with Sonic Playground.

Rachel Lee-Project 03-Dynamic Drawing-Section E

Rachel Lee Dynamic Drawing Sketch

/* Rachel Lee
rwlee
Section E
Project-03: Dynamic Drawing */

var outerD = 350;
var innerD = 300;
var hours = 10;
var r = 0;
var g = 0;
var b = 0; 
var planetR = 60;
var sunY = 0;
var moonY = 480; 
var angle = 0;
var increment = 0.1;
var angle = 0;
var position1 = 0;
var position2 = 105;
var position3 = 65;
var position4 = 215;
var position5 = 25;
var position6 = 345;

function setup() {
    createCanvas(640, 480);
}

function draw() {
	background(r, g, b);
// top right quadrant yellow according to mouse position
    if (mouseX >= 320 & mouseX <= 640 && mouseY >= 0 && mouseY <= 240) {
        r = 235;
        g = 200;
        b = 130; 
    } 
    
// bottom right quadrant pale blue according to mouse position
    if (mouseX >= 320 & mouseX <= 640 && mouseY >= 240 && mouseY <= 480) {
        r = 155;
        g = 195;
        b = 235;
    }
// bottom left quadrant dark blue according to mouse position
    if (mouseX >= 0 & mouseX <= 320 && mouseY >= 240 && mouseY <= 480) {
        r = 30;
        g = 115;
        b = 185;
    }
// top left quadrant navy according to mouse position
     if (mouseX >= 0 & mouseX <= 320 && mouseY >= 0 && mouseY <= 240) {
        r = 15;
        g = 65;
        b = 120;
    }

    // sun rising and setting according to mouse position
    if (mouseX >= 330 & mouseX <= 500 && mouseY >= 65 && mouseY <= 415) {
        sunY = mouseY;
        var sizeSun = map(mouseY, 0, width, 60, 10);
    } else {
        noStroke();
        fill(240, 150, 60);
        sunY = 0;
        ellipse(560, sunY, planetR, planetR);
    }

// drawing sun
    noStroke();
    fill(240, 150, 60);
    ellipse(560, sunY, sizeSun, sizeSun);

// moon rising and setting according to mouse position
    if (mouseX >= 150 & mouseX <= 310 && mouseY >= 65 && mouseY <= 415) {
        moonY = mouseY;
        var sizeMoon = map(mouseY, 0, width, 60, 10);

// drawing stars
        push();
        translate(100, 100);
        rotate(radians(angle));

// animating stars, stars appear when it is 'night time' only
        rectMode(CENTER);
        noStroke();
        fill(210, 240, 245);
        rect(position1, 0, 15, 15);
        rect(position2, 125, 20, 20);
        rect(position3, 300, 10, 10);
        rect(position4, 240, 7, 7);
        rect(position5, 160, 13, 13);
        rect(position4, 270, 9, 9);
        pop();
        angle = angle + 1;
        position1 = position1 + 0.4;
        position2 = position2 - 0.1;
        position3 = position3 + 0.7;
        position4 = position4 - 0.2;
        position5 = position5 + 0.1;
        position6 = position6 - 0.8;

    } else {
        noStroke();
        fill(230, 230, 190);
        moonY = height;
        ellipse(80, moonY, planetR, planetR);
    }

// drawing moon
    noStroke();
    fill(230, 230, 190);
    ellipse(80, moonY, sizeMoon, sizeMoon);

// clock and hour markers on clock
    noStroke();
    fill(140, 195, 200);
    ellipse(320, 240, outerD, outerD);
    fill(180, 225, 225);
    ellipse(320, 240, innerD, innerD);

    fill(220, 90, 95);
    ellipse(320, 110, hours, hours);
    ellipse(320, 365, hours, hours);
    ellipse(180, 240, hours, hours);
    ellipse(450, 240, hours, hours);

// clock hands rotate according to mouse position
    stroke(255);
    strokeWeight(10);
    line(width/2, height/2, mouseX, mouseY); // minute hand
    stroke(0);
    line(width/2, height/2, mouseX + 40, mouseY + 60); // hour hand


}


For this week’s project, I decided to play with the idea of a clock, and illustrating different times of the day. At first I found it a little tricky to catch syntax errors, but as I built more and more variables in, it became really fun to watch my dynamic drawing come to life in a controlled manner.

Rachel Lee-Looking Outwards-03

Living Mushtari by MIT Media Lab Mediated Matter Group, 2015.

The project that I have decided to focus on is Living Mushtari by the MIT Media Lab. While I was first drawn to this project because of the beauty of the generated wearable factory, what I admire the most about this project is how the team who created this project were able to harness biological processes and adapt them for greater human use in a non destructive/ obstructive way. While throughout history humans have not hesitated to destroy for personal gain, Living Mushtari allows for existing biological structures to take place naturally and respects its processes. This project was created using generative growth algorithms that mimic patterns in biological growth, and produce recursive forms over time. The products of such algorithms are useful materials such as pigments and drugs that are a product of microbial symbiosis. While this project serves a practical purpose, the creator’s artistic sensibilities are showcased as the wearable forms are produced in a way that reflect symmetry and conform to the shape of the wearer’s body, as well as highlight the detailed bacterial channels via colors and transparency.