Tanvi Harkare – Project 06 – Abstract Clock

tanvi_sketch

var H;
var M;
var S;

var posX = 0;
var posY = 0;;

var rectSize;

function setup() {  
    createCanvas(480, 300);
}

function draw() {
    noStroke();
    posX = 0;
    posY = 0;
    background("pink");

    //hour
    H = hour();
    for(var i = 0; i < 24; i++){
        if(H == i){
            fill(0);
        }
        else{
            fill(240);
        }
        rect(posX, posY, width / 24, height / 3);
        posX += width / 24; 
    }
    posX = 0;
    posY += 100;
    
    //minute
    M = minute();
    for(var j = 0; j < 60; j++){
        if(M == j){
            fill(0);
        }
        else{
            fill(240);
        }
        rect(posX, posY, width / 60, height / 3);
        posX += width / 60;
    }
    posX = 0;
    posY += 100;

    //second
    S = second();
    for(var k = 0; k < 60; k++){
        if(S == k){
            fill(0);
        }
        else{
            fill(240);
        }
        rect(posX, posY, width / 60, height / 3);
        posX += width / 60;
    }   
}

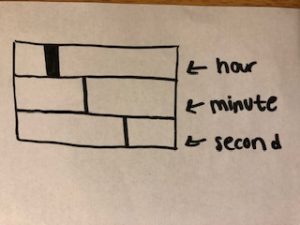
For this project, I was inspired by making a simple abstract clock. My clock resembles a piano, with a white background and black stripes representing the hour, minute, and second in real time.

A quick sketch of what I wanted my clock to look like

Tanvi Harkare – Looking Outwards 06

While it is easy to retrieve random numbers using a computer program, there are a handful of artists who use random numbers picked by hand to create unique pieces of art. One artist that I especially thought was interesting is Kenneth Martin. In this series of paintings, he has a grid of squares that are numbered. He writes down all the numbers on separate pieces of paper and picks out random numbers. Each successive pair of numbers becomes a line, creating similar but very different sets of artworks.

One of Martin’s art pieces
Another art piece with the use of a singular color

What I find interesting about the artist himself is that he used to paint realistic portraits and landscapes for 20 years, before turning to abstract paintings that explored spatial relationships.

Tanvi Harkare – Project 05 – Wallpaper

tanviharkare_sketch

var posX = 75; //starting position of tile x direction
var posY = 20;// starting position of tile y direction
var iteration = 0; //lets program know whether its odd or even row
var count = 0; //know when to terminate the program with noLoop

function setup() {  
    createCanvas(600, 450);
    background(0, 0, 75);
}

function draw() {
    if(iteration === 0){ //even number rows get 4 tiles
        for(var s = 0; s < 4; s++){
            tile(posX, posY);
            posX += 150;
        }
        iteration++;
    }

    else if(iteration === 1){ //odd number rows get 3 tiles to provide hexagonal effect
        for(var d = 0; d < 3; d++){
            tile(posX + 75, posY);
            posX += 150;
        }
        iteration--; 
    } 
    posX = 75;
    posY += 100;

    if(count > 13){
        noLoop();
    }
}

function tile(x, y){ //new function actually producing the tile with x, y parameters
    stroke(220, 219, 214);
    strokeWeight(1);
    line(x, y, x - 50, y + 50);
    line(x - 50, y + 50, x, y + 100);
    line(x, y + 100, x + 50, y + 50);
    line(x + 50, y + 50, x, y);

    line(x, y, x - 40, y + 50);
    line(x - 40, y + 50, x, y + 100);
    line(x, y + 100, x + 40, y + 50);
    line(x + 40, y + 50, x, y);

    line(x, y, x - 30, y + 50);
    line(x - 30, y + 50, x, y + 100);
    line(x, y + 100, x + 30, y + 50);
    line(x + 30, y + 50, x, y);

    line(x, y, x - 20, y + 50);
    line(x - 20, y + 50, x, y + 100);
    line(x, y + 100, x + 20, y + 50);
    line(x + 20, y + 50, x, y);

    line(x, y, x - 10, y + 50);
    line(x - 10, y + 50, x, y + 100);
    line(x, y + 100, x + 10, y + 50);
    line(x + 10, y + 50, x, y);

    count++;
}

The wallpaper that inspired me for my wall paper

I was inspired by a simple, modern wall paper to create a singular tile that would be repeated in the hexagonal pattern we learned about in Assignment 5B. I created a new function tile(x, y) with two parameters (starting x location and starting y location) to create a set of tiles on a background.

Tanvi Harkare – Looking Outwards 05

A project that deals with 3D computer graphics that I found interesting was the animation called On the Road to Nowhere. This project was done by Mohamed Chahin, who uses a software called Blender 3D to create different types of animations. This project focuses on a small, blue monster who Is riding an orange airplane. Although the animation is short, the quality of the animation is very good; the short animation keeps repeating itself with no obvious sign of it looping repeatedly. Some other aspects of 3D graphics that Blender 3D is capable of includes rigging, modeling, simulations, renderings, and motion tracking. Chahin uses Blender in some of his other works, sometimes pairing it along with Photoshop and other Adobe software.

A capture from Chahin’s animation

I really like these types of projects because they seem like small projects that can be done in a shorter amount of time than other design projects. I am interested in knowing what would happen if you combined these smaller projects to create one big project. I assume that many animations would turn into a movie, or even a video game if it were interactive with a user.   Click here for a link to his full project portfolio. 

Tanvi Harkare – Project 04 – String Art

tanviharkare_sketch

/*Tanvi Harkare
Section B
tharkare@andrew.cmu.edu
Project-04-String Art */

var R; //variables for random color for line
var G;
var B; 

var x1 = 0; //starting points for location of lines
var x2 = 0;
var y1 = 0; 
var y2 = 100;

var x3 = 25; //starting position for second set of lines
var x4 = 25;
var y3 = 25;
var y4 = 150;

var x5 = 50; //starting position for third set of lines
var x6 = 50;
var y5 = 50;
var y6 = 200;

var x7 = 75; //starting position for fourth set of lines
var x8 = 75;
var y7 = 75;
var y8 = 250;

var x1stepSize = 15; //increment values for each point
var x2stepSize = 5;
var y1stepSize = 0;
var y2stepSize = 10;

var x3stepSize = 20; //increment values for second set of lines
var x4stepSize = 10;
var y3stepSize = 0;
var y4stepSize = 10;

var x5stepSize = 25; //increment value for third set of lines
var x6stepSize = 15;
var y5stepSize = 0;
var y6stepSize = 10;

var x7stepSize = 20; //increment value for fourth set of lines
var x8stepSize = 10;
var y7stepSize = 0;
var y8stepSize = 10;

function setup() {  
    createCanvas(400, 300);
    background(0);
}

function draw() {
    //curve starting from 0, 0
    for(var i = 0; i < 50; i++){
        curveChange = random(.35, 1);
        changeColor(); 
        stroke(R, G, B);
        line(x1, y1, x2, y2);
        x1 += x1stepSize;
        x2 += x2stepSize;
        y2 -= y2stepSize;
        y2stepSize -= curveChange;       
    }

    //curve starting from 25, 25
    for(var i = 0; i < 50; i++){
        curveChange = random(.35, 1);
        changeColor(); 
        stroke(R, G, B);
        line(x3, y3, x4, y4);
        x3 += x3stepSize;
        x4 += x4stepSize;
        y4 -= y4stepSize;
        y4stepSize -= curveChange;       
    }

    //curve starting from 50, 50
    for(var i = 0; i < 50; i++){
        curveChange = random(.35, 1);
        changeColor(); 
        stroke(R, G, B);
        line(x5, y5, x6, y6);
        x5 += x5stepSize;
        x6 += x6stepSize;
        y6 -= y6stepSize;
        y6stepSize -= curveChange;       
    }

    //curve starting from 75, 75
    for(var i = 0; i < 50; i++){
        curveChange = random(.35, 1);
        changeColor(); 
        stroke(R, G, B);
        line(x7, y7, x8, y8);
        x7 += x7stepSize;
        x8 += x8stepSize;
        y8 -= y8stepSize;
        y8stepSize -= curveChange;       
    } 
}

function changeColor(){
    /* assigns different color values for every
    line that is drawn in the draw() function */ 
    R = random(0, 255);
    G = random(0, 255);
    B = random(0, 255);
}

I had a lot of fun with this project, especially in creating different ways to show the curves made through the string art. In my sketch, the color of each line is different and changes each time you run the code; I did this by creating my own function. Additionally, the curvature of the string art changes slightly to create a different effect ever time.

Tanvi Harkare – Looking Outwards – 04

A project that dealt with computational soundscapes is the Meandering River, created by the Funkhaus Berlin and onformative collaboration. The inspiration behind the project is the historical difference in landscapes, especially in bodies of water, that are made overtime. The objective of the art piece is to capture these changes that cannot be usually seen by the human eye. The algorithm that was specifically created for this project combines the river and surface patterns and classical music, composed by the Kling Klang Klong group, to create a colorful display. It was displayed at the Funkhaus Sound Chamber in Berlin from July 27th to the 30th in the year 2018. The creators of the project hoped that the imagery would help create a unique experience in terms of time, nature, and the emotional journey it can take us through.

I think the project is a unique way of converting audio into a dynamic visual painting. While the story behind the audiovisual installation is moving, one way they could have improved the user experience is having the art be more interactive. For example, a different image would be displayed whenever someone stood in front of it, or even touched the artwork.  

A view of the Meandering River at the Funkhaus Berlin

Tanvi Harkare – Looking Outwards – 03

One of the projects discussing computational digital fabrication is part of the MAAD program at CMU. In addition to fabrication, the program consists of architectural robotics and ecological thinking. There are multiple different studios that you can choose from in this program, but the one that interests me the most deals with experimentation with new and different materials that explore contemporary design techniques. The design process starts with using some type of algorithm to create a parametric design. Next, this can be translated into either a physical model or a 2D drawing. Some digital fabrication tools that are helpful to completing projects include 3D modeling software, robotic arms, laser cutting machines, and a CNC router. 

A 3D model created using computational design software

As an architecture undergraduate student at CMU, I’m interested in any future paths I might be able to take. The importance of computational fabrication is increasing greatly in architecture schools; we are taught computational fabrication as early as the second year of the undergraduate program. For example, we had to create an object using fiberglass and resin that was designed using a computational program called Grasshopper, which works through the 3D modeling software Rhino. 

An example of Rhino 3D modeling software and a Grasshopper script


Tanvi Harkare – Project 03 – Dynamic Drawing

tharkare project 3

/* Tanvi Harkare
Section B
tharkare@andrew.cmu.edu
Project-03-Dynamic Drawing */ 

var r = 1.9;
/*taking the canvas height and width and divided by 255,
the max number allowed in an RGB value. This ensure that no matter
where mouseX or Y is, the colors will continue changing*/

function setup() {  
    createCanvas(640, 480);
}

function draw() {
    noStroke();
    background(255 - mouseX/1.9); //fades background out from black to white
    var i = 0; //keeps count of how many rectangles are created
    var posX = 10; //starting x point for rectangle
    var posY = 5; //starting y point for rectangle
    while(i < 130){
        push();
        translate(mouseX, mouseY);
        rotate(radians(mouseX));
        fill(10, mouseX/r, mouseY/r);
        rect(posX, posY, mouseX/12.8, mouseY/12.8); //range for rectangle size is 10 to 50 pixels. 
        i++;
        posX += 50;
        if(posX >= width){ //creates a new row of rectangles
            posX = 10;
            posY += 50;
        }
    }
    pop();
}

I had a lot of fun with this project, especially in experimenting with the while loop. An example of this is analyzing what happens when certain functions are included inside the loop. My push() function is included in the while loop, while the pop() function is called after the while loop ends. Doing vice versa also creates a similar drawing. Depending on the location of the mouse in the x and y direction, the color, size, position, and angle of the rectangles change. Additionally as the mouse moves across the canvas, the background fades from black to white. I was inspired by simple geometric shapes to create a drawing that catches the eye.

Tanvi Harkare – Project 02 – Variable Face

tanvi_facevariable

/* Tanvi Harkare
Section B
tharkare@andrew.cmu.edu
Project-02-Face Variables */

var eyeSize = 20;
var faceWidth = 100;
var faceHeight = 150;
var eyeColorR = 150
var eyeColorG = 250
var eyeColorB = 5;
var mouthWidth = 50;
var mouthHeight = 30; 
var mouthY = 340; 
var browHeight = 300;
var eyeHeight = 320;

function setup() {  
    createCanvas(480, 640); 
}

function draw() {
    background(150);

    //hair
    stroke(0);
    strokeWeight(150);
    line(width/2, height/2 - 20, width/2, height - 225);

    //face
    fill(255, 220, 177);
    noStroke(); 
    ellipse(width / 2, height / 2, faceWidth,  faceHeight);

    //eyes
    noStroke();
    var eyeLX = width / 2 - faceWidth * 0.25;
    var eyeRX = width / 2 + faceWidth * 0.25;
    fill(255);
    ellipse(eyeLX, eyeHeight, eyeSize, eyeSize); //left eye
    ellipse(eyeRX, eyeHeight, eyeSize, eyeSize); //right eye
    //pupils
    fill(eyeColorR, eyeColorG, eyeColorB);
    ellipse(eyeLX, eyeHeight, eyeSize/2, eyeSize/2); //left pupil
    ellipse(eyeRX, eyeHeight, eyeSize/2, eyeSize/2); //right pupil

    //mouth
    noFill();
    strokeWeight(2);
    stroke(100, 75, 80);
    arc(240, mouthY, mouthWidth, mouthHeight, 0, 3.14, OPEN);

    //eyebrows
    strokeWeight(2);
    stroke(0);
    line(eyeLX - 10, eyeHeight - 10 - eyeSize, eyeLX + 10, eyeHeight - 10 - eyeSize);
    line(eyeRX - 10, eyeHeight - 10 - eyeSize, eyeRX + 10, eyeHeight - 10 - eyeSize);

    //nose
    noStroke();
    fill(198, 171, 137);
    ellipse(width/2, height/2 + eyeSize, 10, 8);
}

function mousePressed() {
    // when the user clicks, these variables are reassigned
    // to random values within specified ranges. For example,
    // 'faceWidth' gets a random value between 75 and 150.
    faceWidth = random(100, 130);
    faceHeight = random(110, 160);
    eyeSize = random(10, 20);
    eyeColorR = random(0, 255);
    eyeColorG = random(0, 255);
    eyeColorB = random(0, 255);
    mouthWidth = random(30, 60);
    mouthHeight = random(20, 40);
    mouthY = random(335, 350);
    browHeight = random(290, 305);
    eyeHeight = random(315, 325);
}

For this project, I created a face from simple shapes such as ellipses, arcs, and lines. My favorite part of the project was coming up with different ways to create a unique face with colors, size, and position on the face. At first I had a difficult time dealing with facial features that were overlapping, but was able to solve that by changing the values of the random integers near the end .

Tanvi Harkare – Looking Outwards – 02

A project that I really liked is the Digital Type Wall that was created for Monotype, and then exhibited in the Metropolitan Wharf in London, UK in November of 2012. The exhibition and print design were created by the SEA design team, and the installation concept and code were created by Marcin Ignac and the Variable team. The project was created in collaboration with the Pencil to Pixel exhibition to help show how typography has changed through the years. There are over 6,000 different combinations that can be shown based off the animation that creates it, and it takes typography from over hundreds of fonts. The custom software was created using a Plask framework which creates the animation that chooses the specific fonts to display. Based off the video that I saw about the project, I assume there is a library of characters that this software goes through and creates an animation to display them in a random order.

 I find this project interesting because of the variety of fonts that it displays. Because of this workflow, its engaging for all audience types and provides a unique experience. I think if the exhibit were more interactive, it would be more successful in helping to engage the audience further. Additionally, it seems that the project currently is just displaying the characters in a grid-like format. Although this creates a clean look which is easy to understand and look at, it would be interesting if the letters formed into something else, like a symbol or object. For more information about this project, visit the website here