Vicky Zhou – Project 07 – Curves

sketch

/*Vicky Zhou
Section E
vzhou@andrew.cmu.edu
Project_07_Curves*/

var nPoints = 50; //amount of mapped out points
var EPITROCHOID1 = 0; // parametric form 
var HYPOTROCHOID = 0; //parametric form

function setup() {
    createCanvas(480, 480);
}

function draw() {
	background(15, 15, 25);
	translate(width/2, height/2);
	//draw light blue epitrochoid curve
	drawEPITROCHOID1();
	//draw light pink hypotrochoid curve
	drawHYPOTROCHOID();
	//draw orange circle epitrochoid curve
	drawEPITROCHOID2();
	//draw yellow circle epitrochoid curve
	drawEPITROCHOID3();
}

function drawEPITROCHOID1() {
	push();
	stroke(140, 200, 240);
	strokeWeight(0.75);
	noFill();
	var x; //x pos
	var y; //y pos
	var t = 90; //angle variable
	var b = constrain(mouseX / 100, 0, 10); //outside curve variable
	var h = map(mouseY, 0, mouseY, 30, height/2); //height variable
	beginShape();
	for (var i = 0; i < nPoints; i ++){
		var a = map(i, 0, nPoints, 0, TWO_PI); //inside circle size variable 
		x = (a + b) * cos(t) - h * cos (((a + b) / b) * t); //parametric eq1
		y = (a + b) * sin(t) - h * sin (((a + b) / b) * t); //parametric eq2
		vertex (x + random(0, 2), y + random(0, 2));
	}
	endShape();
	pop();
}

function drawHYPOTROCHOID() {
	push();
	strokeWeight(0.5);
	stroke(190, 140, 140);
	noFill();
	var x; //x pos
	var y; //y pos
	var t = constrain(mouseX / 10, 0, 100); //angle variable
	var b = 5; //outside curve variable
	var h1 = constrain(mouseX/ 2, width/4, width/3); //height variable 1 
	var h2 = constrain(mouseY/2, width/3, width/2); //height variable 2
	beginShape();
	for (var i = 0; i < nPoints; i++){
		var a = map(i, 0, nPoints, 0, TWO_PI); //inside circle size variable
		x = (a - b) * cos(t) + h1 * cos(((a - b)/b) * t);
		y = (a - b) * sin(t) + h2 * sin(((a - b)/b) * t);
		vertex(x, y);
	}
	endShape();
	pop();
}

function drawEPITROCHOID2() {
	push();
	noStroke();
	fill(100, 130, 190);
	var x; //x pos
	var y; //y pos
	var t = 100; //angle variable
	var b = constrain(mouseX / 100, 0, 10); //outside curve variable
	var h = constrain(mouseX/2, 0, 100); //height variable
	beginShape();
	for (var i = 0; i < nPoints; i ++){
		var a = map(i, 0, nPoints, 0, TWO_PI); //inside circle size variable 
		x = (a + b) * cos(t) - h * cos (((a + b) / b) * t); //parametric eq1
		y = (a + b) * sin(t) - h * sin (((a + b) / b) * t); //parametric eq2
		ellipse(x + random(-1, 1), y + random(-1, 1), 5, 5);
	}
	endShape();
	pop();
}

function drawEPITROCHOID3() {
	push();
	stroke(160, 140, 110);
	strokeWeight(0.3);
	noFill();
	var x; //x pos
	var y; //y pos
	var t = 190; //angle variable
	var b = constrain(mouseX, 0, 5); //outside curve variable
	var h = map(mouseY, 0, mouseY, 30, height/2); //height variable
	beginShape();
	for (var i = 0; i < nPoints; i ++){
		var a = map(i, 0, nPoints, 0, TWO_PI); //inside circle size variable 
		x = (a + b) * cos(t) - h * cos (((a + b) / b) * t); //parametric eq1
		y = (a + b) * sin(t) - h * sin (((a + b) / b) * t); //parametric eq2
		vertex(x + random(-5, 5), y + random(-3, 3));
	}
	endShape();
	pop();
}

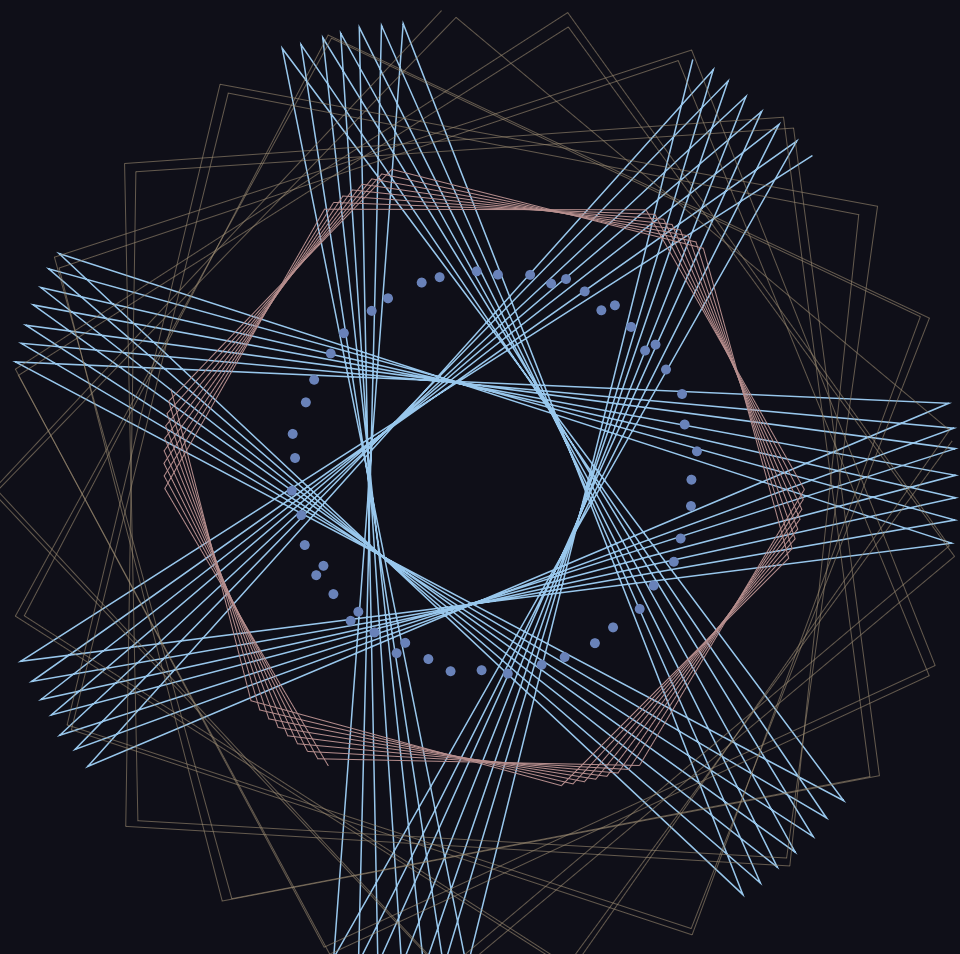
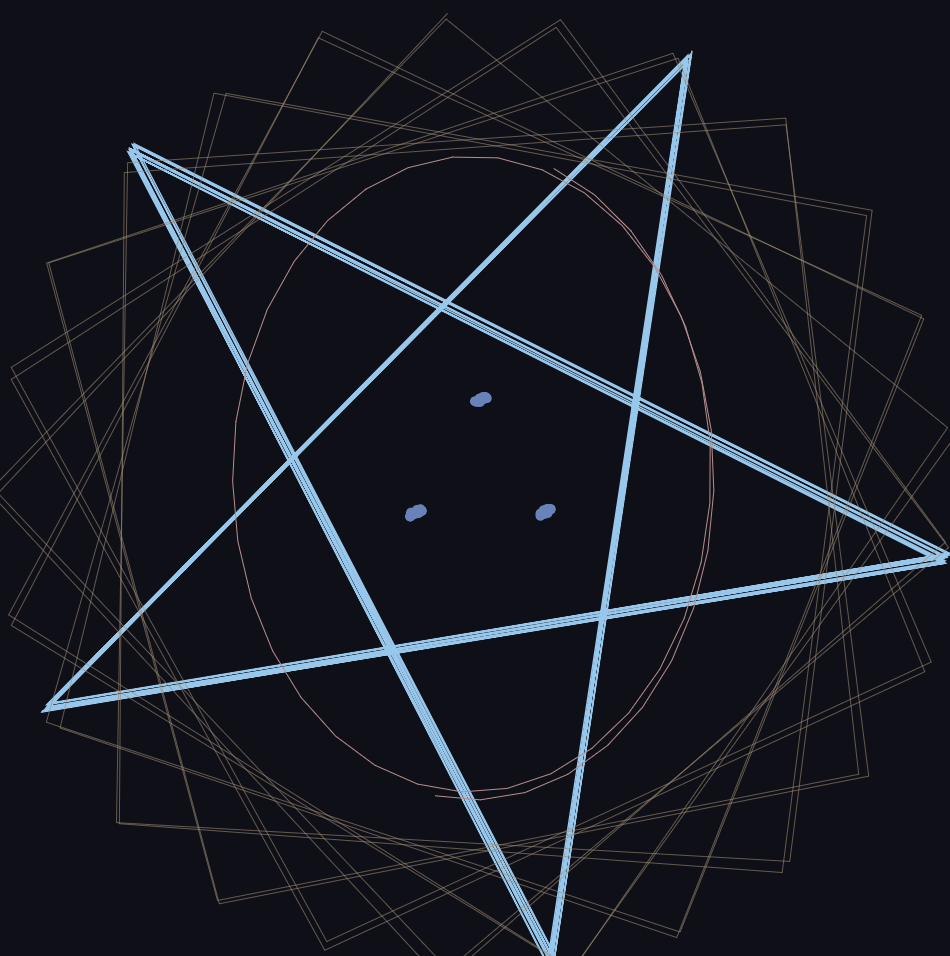
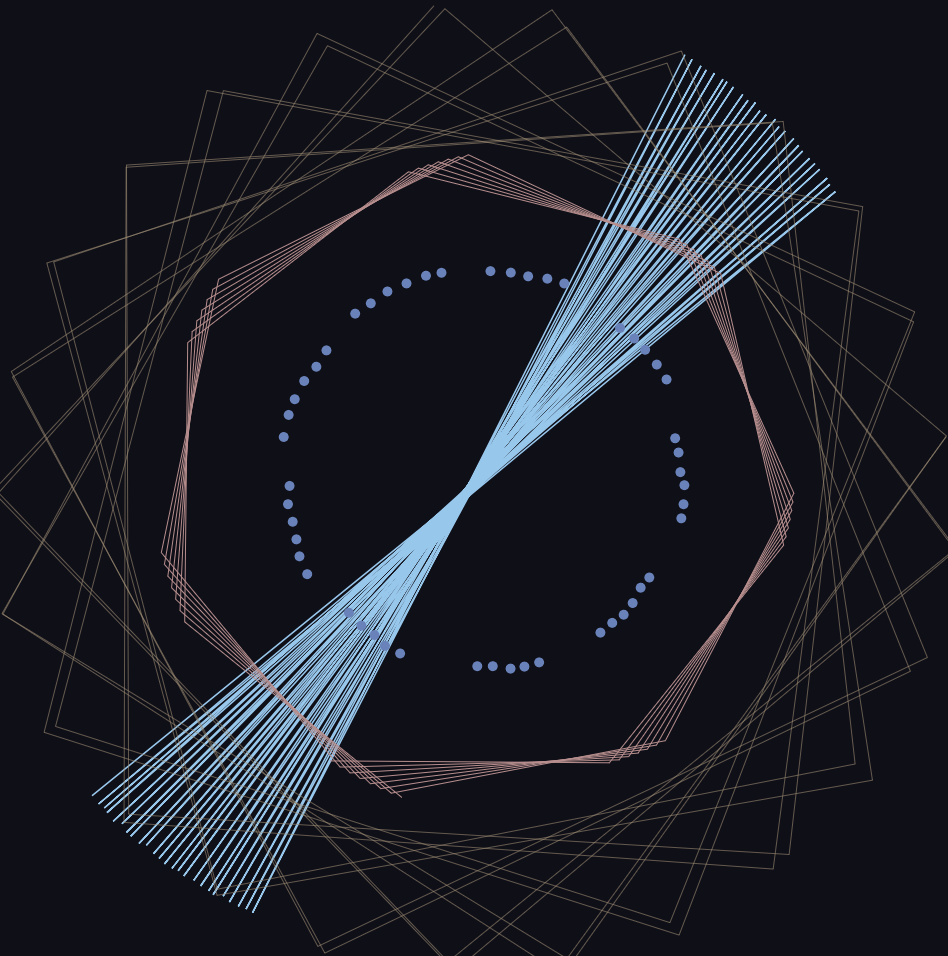
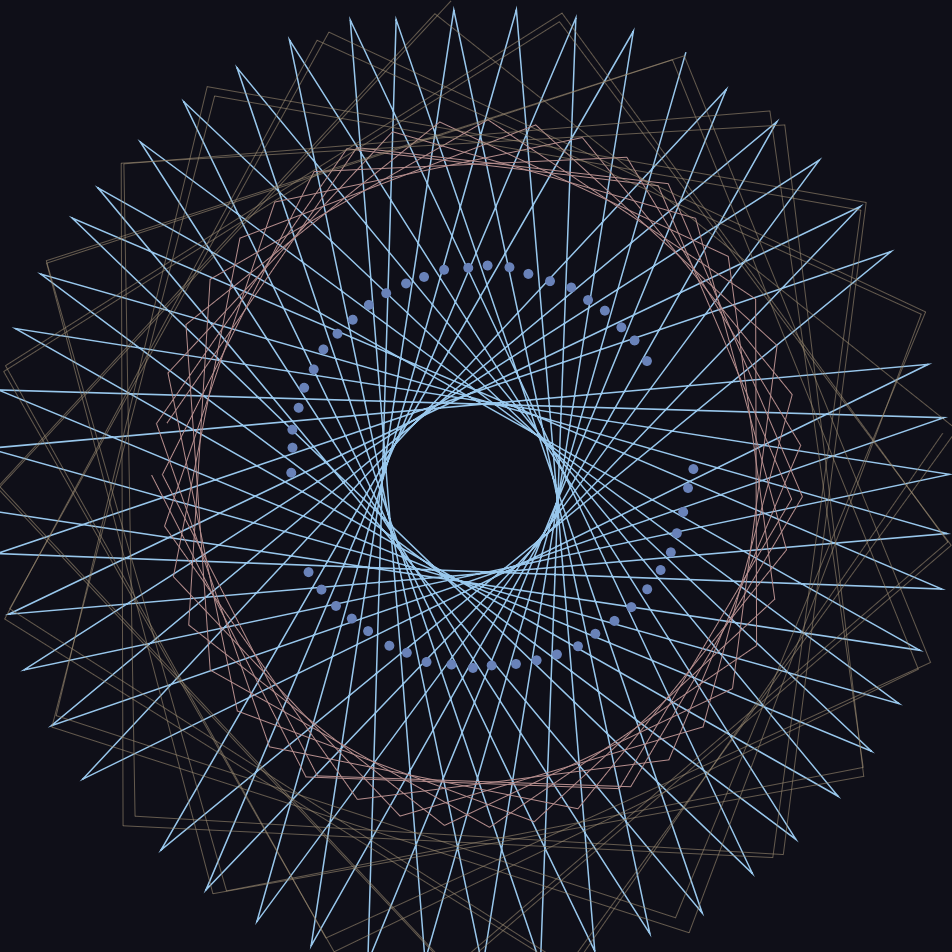
This project was incredibly satisfying to make! Although it was a bit of a struggle at first to understand what each variable manipulated in the curve, plugging in random values and seeing what was affected was helpful and how I learned how to manipulate my curves into the desired look. I added a bit of “jitter” effect to my curves as well because I enjoy how they make the piece feel like it is constantly interactive even when the user is not altering the curves. For future iterations and/or ideas I think it would be interesting to incorporate equations that are not necessarily parametric, explicit, and/or polar.

Example 1
Example 2
Example 3
Example 4

Vicky Zhou – Looking Outwards – 07

Peak Spotting

Studio NAAD is a design firm that focuses on data visualization and interactive design. “Peak Spotting” is one of their projects for Germany railway company, Deutsche Bahn, that helps visualize railway traffic for Germany’s daily passengers. Peak Spotting compiles together Deutsche Bahn’s entire network of load and capacity prediction, and integrates it with task management tools and customizable visualizations to create an accessible and easy to decipher map. This intelligible map allows passengers to plan out trips in advance and optimize their route, and allows conductors to coordinate trains and traffic. I really admire this project because it is difficult to convey the hectic and abundant amount of data that is a train system in an accurate and straightforward manner, especially in major cities such as Berlin.

Vicky Zhou – Project 06 – Clock

sketch

/*Vicky Zhou
Section E
vzhou@andrew.cmu.edu
Project-06-Clock*/ 

var prevsec;
var millisrollover;

function setup() {
    createCanvas(480, 480);
    millisrollover = 0;
}

function draw() {
	background(255);

	//current time 
	var h = hour();
	var m = minute();
	var s = second();


	//changes military to standard time
	if(h > 12){
		h = h - 12; 
	}

	//making seconds beocme smoother
	if (prevsec != s){
		millisrollover = millis();
	}
	prevsec = s;
	var mills = floor(millis() - millisrollover);
	var secfraction = s + (mills / 1000);

	//map function to adjust ratio of time to canvas size
	var hourmap = map(h, 0, 12, 0, height);
	var minmap = map(m, 0, 59, 0, height);
	var secmap = map(secfraction, 0, 59, 0, height);


	// seconds that spiral outwards 
		push();
		for (i = 0; i <= 360; i ++){
			fill(secmap, 180, 190, 5);
			stroke(200, 100, 20);
			strokeWeight(0.9);
			rotate(degrees(180));
			translate(-390, -300);
			ellipse(width/2, height/2, secmap, secmap);
		}
		pop();


	//min triangle that shifts from left to right
		push();
		for (i = 0; i <= 360; i ++){
			fill(200, minmap, 190, 20);
			stroke(100, 100, 200);
			strokeWeight(1);
			triangle(i + 480, 480, 0, i + 480, minmap, i * 20);
		}
		pop();


	//hour bar that travels from top to bottom 
		push();
		for (i = 0; i <= 360; i += 20){
			fill(240, 240, 240, 0.05);
			stroke(100, 120, hourmap);
			strokeWeight(1.5);
			rectMode(CENTER);
			rect(100, hourmap, 1000, i/3);
		}
		pop();
}

After reading of the brief history of time with clocks, I was most intrigued by the idea of the “sunflower clock” and other patterns in nature that stray away from the conventional “sun and moon” diagram. Initially, I wanted to create a cock that mimicked the high and low tide of the beach, with perhaps waves being the second, sea foam being the minutes, and sand particles on the beach being hours. However, I was much more drawn to the works of Vincent Toupe, and how interesting and dynamic his abstract clocks were. Therefore, I then decided to hash out a more abstract clock with seconds represented by a growing ring, minutes represented by a triangle that shifts from left to right, and hours represented by a bar that shifts up and down. My first iteration of this abstract clock had started off with all three “hands” being represented by circles, but I wanted some other more obvious, visual representation between the seconds, minutes, and hours.

Abstract clock sketches

Vicky Zhou – Looking Outwards – 06

“ADA”

Karina Smigla-Bobinski is an intermedia artist that focuses on new media and digital art. One of her more well-known works, “ADA”, is an interactive kinetic drawing installation that produces random strokes due to the nature of how this project was constructed and is meant to be interacted with. ADA is a enormous transparent, helium sphere with charcoal stumps attached all along the outside. This sphere is placed in the context of an expansive, all-white room, in which the user can engage with the sphere by pushing it around. As a consequence of such interaction, random black strokes are drawn, strewn, dotted, and created across the white walls.

Although Karina created ADA with precise measurements and specific intentions — crafting of the helium sphere, strategic placement of the charcoal stubs, and size of the room — the result of her work becomes random — marks created by the public.

Vicky Zhou – Project 5 – Wallpaper

sketch

/*Vicky Zhou
Section E
vzhou@andrew.cmu.edu
Project-05-Wallpaper*/

var x1 = 50; 
var y1 = 50; 

function setup() {
    createCanvas(480, 480);
    background(250, 240, 220);
    noLoop();
}

//creating own function to draw one houndstooth 
function houndstooth(x1, y1) {
	print(x1,y1);
	//draw one houndstooth
	var sqsize = 50; 
	// for (var i = 0; i <= 100; i += 10);
		fill(177, 92, 62); //brown
		noStroke();
		rect(x1, y1, sqsize, sqsize); //rectangle center
		triangle(x1, y1, //first triangle pointy part 
				x1 - (sqsize/2), y1,
				x1, y1 + (sqsize/2));
		triangle(x1, y1, //second triangle pointy part
				x1 + (sqsize/2), y1,
				x1, y1 - (sqsize/2));
		triangle(x1, y1 + (sqsize), //left top 
				x1 + (sqsize/2), y1 + (3 * sqsize/2), 
				x1 + (sqsize/2), y1 + (sqsize));
		triangle(x1 + (sqsize/2), y1 + (3 * sqsize/2), //left bottom
				x1 + (sqsize), y1 + (3 * sqsize/2),
				x1 + (sqsize), y1 + (2 * sqsize));
		triangle(x1 + (sqsize), y1, //right top 
				x1 + (sqsize), y1 + (sqsize/2),
				x1 + (3 * sqsize /2), y1 + (sqsize/2));
		triangle(x1 + (3 * sqsize/2), y1 + (sqsize/2), //right bottom
				x1 + (3 * sqsize/2), y1 + (sqsize),
				x1 + (2 * sqsize), y1 + (sqsize));
		triangle(x1 + (sqsize/2), y1 + (sqsize), //left connecting triangle
				x1 + (sqsize/2), y1 + (3 * sqsize/2),
				x1 + (sqsize), y1 + (3 * sqsize/2));
		triangle(x1 + (sqsize), y1 + (sqsize/2), //right connecting triangle
				x1 + (3 * sqsize /2), y1 + (sqsize/2),
				x1 + (3 * sqsize/2), y1 + (sqsize));
				
				
}

function draw() {
	for (var y = 0; y <= height; y+= 100){
		for (var x = 0; x <= width; x += 100){
			houndstooth(x + 30, y + 30); //draws houndstooth

			//first stitch mark
			fill(40, 32, 24, 150); //black
			ellipse(x, y + 50, 3, 60);
			ellipse(x, y + 50, 60, 3);

			//second stitch mark
			fill(250, 240, 220, 100); //cream 
			ellipse(x + 50, y + 50, 3, 60);
			ellipse(x + 50, y + 50, 60, 3);

		}
	}
}

In this project prompt, the idea of a “wear-able” pattern immediately made me think of houndstooth, plaid, and Patagonia’s fleeces. In the end, I decided to draw my main inspiration from an urban outfitter’s houndstooth dress. I constructed it using squares and triangles, and also wanted to add an element of a “stitch” to create the texture of fabric. The concept that I struggled the most with during this pattern was constructing my own function (houndstooth), because it was difficult to reposition it in the draw function.

Vicky Zhou – Looking Outwards – 05

Air Max Promo Video

Nike’s Air Max 2017 launch utilizes 3D computer and motion graphics in an incredibly captivating way by playing with a diverse range of textures, interesting use of negative spaces, and metaphorical explorations of air and “lightness”. As with other Nike marketing and products, there is an immense team dedicated to all aspects of the creation of these ads and fine-tuning all the details, so the end result is nothing short of being incredibly hyper realistic. Nike creates a variety of different styles of the Nike Air Max by composing it through several different 3D computer graphic “mediums”, such as colored sand, toothpaste like texture, gum like strings, soft bunched up fabric, physical air balloon pockets, rubber sole like material, and so on. In addition, because many of these 3D computer graphics also evolved into motion graphics, they enabled another dimension in where the viewer could understood how the “material” behaved and reacted to gravity, pressure, and tension.

Air Max 2017
Air Max 2017 example
Air Max 2017 Campaign
Air Max 2017 Campaign cont.

Vicky Zhou – Project 04 – String Art

sketch

/* Vicky Zhou
Section E 
vzhou@andrew.cmu.edu
Project 04 -String Art*/

var x; //first x cord
var y; //first y cord
var x2; //second x cord
var y2; //second y cord
var dir =1; //direction of lines

function setup() {
    createCanvas(400, 300);
    background(0);
}

function draw() {
	for (var i = 0; i <= 1; i += 0.05){
		//creates upper right hand corner
		push();
		stroke(255);
		strokeWeight(0.02);
		x = lerp(0, width, i);
		y = 0;
		y2 = lerp(0, height, i);
		x2 = width;
		line(x, y, x2, y2);	
		pop();

		//creates lower left hand corner 
		push();
		stroke(255);
		strokeWeight(0.02);
		x = 0;
		y = lerp(0, height, i);
		x2 = lerp(0, width, i);
		y2 = height;
		line(x, y, x2, y2);
		pop();

	}

	//creates upper left hand corner in light yellow
	for(var i = 0; i <= width; i += 0.05){
		stroke(246, 236, 196);
			push();
			strokeWeight(0.5);
			x = lerp(width/2, height, i);
			y = 0;
			x2 = 0;
			y2 = lerp(height, width/2, i);
			line(x, y, x2, y2);
			pop();
	}

	//creates upper right hand corner in blue
	for(var i = 0; i <= width; i += 0.05){
		stroke('BLUE');
			push();
			strokeWeight(1);
			x = lerp(width/2, height, i);
			y = 0;
			x2 = 0;
			y2 = lerp(height, width/2, i);
			line(x, y, x2, y2);
			pop();
	}

	//creates lower right hand corner in white
	for(var i =0; i <= height; i += 0.05){
		stroke(255);
			push();
			strokeWeight(0.5);
			x = width;
			y = lerp(0, width/2, i);
			x2 = lerp(width/2, 0, i);
			y2 = height;
			line(x2, y2, x, y);
			pop();
	}

	//creates lower right hand corner in green
	for(var i =0; i <= height; i += 0.05){
		stroke('YELLOW');
			push();
			strokeWeight(1);
			x = width;
			y = lerp(0, width/2, i);
			x2 = lerp(width/2, 0, i);
			y2 = height;
			line(x2, y2, x, y);
			pop();
	}

	//creates top right red
	for(var i = 0; i <= width; i += 0.02){
		stroke('RED');
		strokeWeight(0.02);
		x = 0;
		y = lerp(width/3, width*(2/3), i);
		x2 = lerp(width/3, width*(2/3), i);
		y2 = 300;
		line(x, y*mouseY, x2, y2);
		}

}

Making this was a lot of fun and very interesting because of the ability to play with different line weights, and the different spacing with the lerp function. However, it got frustrating at times when I wanted to “flip” or “reflect” the exact bottom or top because sometimes I would have trouble remembering what x-cord and y-cord points would stay static and which ones would change. Overall, this project is cool because it provides for really dynamic and trippy motion graphic opportunities.

Vicky Zhou – Looking Outwards 04

“Volume” for Panorama

“Volume” is an interactive and responsive sound and light installation designed for a popular NYC festival, Panorama. The installation is a series of responsive mirrors formatted in a cube; these mirrors rotate individually in response to the presence of people (in this case, excited festival goers), which then redirect light and sound as a result. The mirrors process presence and rotate using cameras, and the LED lights change in response to the changes of sound around them. This data is then converted via DMX, and to the motors via OCP and Arduino microcontrollers.

Although the final result of the project seems to be “created” or “formed” by the viewer (ie. festival goer), the team, Softlab, showcased their own artistic voice by choosing exactly what medium Volume was created in –mirrors, LED lights — and what mediums Volume chooses to interpret — sound and physical movement. I think Volume is a playful installation that is affected by aspects we find fairly simple — sound and movement, but utilizes intricate data interpretation which then creates an elevated and dynamic environment.

Vicky Zhou – Project – 03 – Dynamic Drawing

sketch

/*Vicky Zhou
Section E 
vzhou@andrew.cmu.edu
Project-03 Dynamic Drawing*/

var lineA;  
var r = 2; 
var g = 220;
var b = 340; 
var leftelWidth = 460;
var leftelHeight = 640;
var offset = 10; 
var ballX = 400;
var ballY = 400; 
var boxX = 200;
var boxY = 200;
var diffX = 0;
var diffY = 0;


function setup() {
    createCanvas(480, 640);
    ellipseMode(CENTER);
    rectMode(CENTER);
    lineA = width/ 2;
}

function draw() {

	//changes the background depending on mouse location 
	bg1 = mouseX; 
	bg2 = mouseY; 
	background(bg1/3, g, b);

	//constrainments for left ellipse 
	var leftelWidth = constrain(mouseX, 0, 460);
	var leftelHeight = constrain(mouseY, 0, 640)


	//ellipse that moves in response to mouseX and mouseY location
	push();
	noStroke();
	fill(bg1, bg2, bg2);
	ellipse(0, 0, leftelWidth*1.3, leftelHeight*3);
	fill(bg2, 30, 40);
	pop();

	//having the line follow the mouse
	if (mouseX > lineA) {
		lineA += 3;
		offset = 10;
	}

	if (mouseX < lineA) { 
		lineA -= 3;
		offset = 10;
	}

	//lag in first ball that follows
	diffX = mouseX - ballX;
	diffY = mouseY - ballY;
	ballX = ballX + 0.1*diffX;
	ballY = ballY + 0.1*diffY;

	//lag in second box that follows
	diffX = mouseX - boxX;
	diffY = mouseY - boxY;
	boxX = boxX + 0.05*diffX;
	boxY = boxY + 0.05*diffY; 

	ellipse(mouseX, mouseY, 10, 10); //cursor mouse
	strokeWeight(10);
	stroke(200, 400, 10);
	line(mouseX, 0, lineA, height); // first line that follows
	ellipse(ballX, ballY, 20, 20); // first ball that follows
	rect(boxX, boxY, 30, 30); // second box that follows

	//"ouch" text that appears when you prod the circle
	push();
	textSize(40);
	fill(490, 20, 35);
	noStroke();
	if (dist(50, 50, mouseX, mouseY) < width/2) 
		text("ouch", 30, 50);
	pop();


}

Due to the combination of such an open-ended prompt and the introduction of so many new functions and/or forms of writing visual code, I struggled quite a lot with this project on what I wanted to achieve as well as how to write it in a way so that it would not be extremely cluttered. Ultimately I decided to recreate a childhood favorite simulation of having a series of shapes and/or objects follow your mouse as you move it across the screen. I also thought it would be funny if there was a stick to be included that would squish a circle blob to one side. She says ouch and glows red when you do so.

Vicky Zhou – Looking Outwards – 03

“Sombra Verde”

“Sombra Verde” is a bamboo pavilion constructed by AIRLAB and Singapore University of Technology and Design utilizing raw bamboo poles, 3D printed connectors, and a transparent polycarbonate roof. Unlike traditional building methods, which utilize natural materials haphazardly and through guess and check estimation to a certain extent, the researchers, designers, and builders for Sombre Verde constructed this canopy with the optimization of each bamboo pole’s position. To do so, they measured and digitized the thickness, height, and bend of each bamboo pole, processed that in their algorithmic machine, which then calculated the optimal capacity and positioning of each pole. In addition, this data was used to design and fabricate the connecting PLA (inexpensive, plant based plastic) that would hold these bamboo poles together. In juxtaposition with the rigid computation of optimal bamboo positioning, the designer’s personal sensibilities shine through with the choice of a bright green, roof, which seem to mimic a large leaf.

I appreciate this architectural piece because of how it incorporates an obviously man-made shelter into nature (bright plastic green roof), without stripping the project of certain natural components (raw bamboo poles) whilst using technology to optimize it’s strength and infrastructure so that it can stand the test of time and nature, rather than become obsolete and broken in a couple years time.

PLA connectors
aerial view