Mimi Jiao and Sophia Kim – Final Project

Wait a few seconds… it’s loading! 🙂
Click to start! (Click mouse to see next visual)

sketch

//variables to load sound 
var sound1;
var sound2;
var sound3;
var sound4;
var sound5;
var sound6;
//variable to switch between shapes and songs
var toggle = 0;
//variable for drawing astroid (toggle 2 shape)
var power = 33;
var r = 255; 

function setup() {
    createCanvas(500, 500, WEBGL);
    amplitude = new p5.Amplitude();
    frameRate(40);
}

function preload() {
    sound1 = loadSound("https://courses.ideate.cmu.edu/15-104/f2018/wp-content/uploads/2018/12/york.mp3");
    sound1.setVolume(1);

    sound2 = loadSound("https://courses.ideate.cmu.edu/15-104/f2018/wp-content/uploads/2018/12/prettiestvirgin.mp3");
    sound2.setVolume(1);

    sound3 = loadSound("https://courses.ideate.cmu.edu/15-104/f2018/wp-content/uploads/2018/12/purity.mp3");
    sound3.setVolume(1);

    sound4 = loadSound("https://courses.ideate.cmu.edu/15-104/f2018/wp-content/uploads/2018/12/pizza.m4a");
    sound4.setVolume(1);

    sound5 = loadSound("https://courses.ideate.cmu.edu/15-104/f2018/wp-content/uploads/2018/12/Siamese_Sea.mp3");
    sound5.setVolume(1);

    sound6 = loadSound("https://courses.ideate.cmu.edu/15-104/f2018/wp-content/uploads/2018/12/perth.mp3");
    sound6.setVolume(1);
}

function draw() {
    background(0);
    noFill();
    stroke(255, 0 ,0);
    //retrieves amplitude of song playing 
    var level = amplitude.getLevel();
    //maps the amplitudes across values for use in shape later on
    var twist = map(level, 0, .6, 0, .3);
    var twist2 = twist * 15000;
    //adjusts the size of the astroids 
    var twistSize = map(level, 0, .3, 75, 300);

    //sophia's twists 
    var twisty1 = map(level, 0, 1, 0, .3);
    var twisty2 = twisty1 * 5;
    var twisty3 = twisty1 * 4;

    //MIMI JIAO'S CODE
    //first shape - Mimi's code
    if (toggle === 1) {
        rotateY(frameCount * twist / 100);
        rotateX(frameCount * twist / 100);
        rotateZ(frameCount * twist / 100);
        for (var i = 0; i < twist2; i++) {
            fill(i * sin(i), i * cos(i), 255);
            beginShape();
            vertex(i * cos(i), i, i - 1000);
            vertex(i * .01, i * 0.1, i * .01);
            vertex(i * sin(i), i * cos(i), i);
            endShape(CLOSE);
        }
    }

    //second shape (astroid) - Mimi's code 
    if (toggle === 2) {
        rotateX(twist);
        rotateY(twist);
        rotateZ(twist);
        //randomizes value so astroid will randomly be bright
        var randomBright;
        randomBright = random(255);
        //first astroid
        beginShape();
        noFill();
        for(var i = 0; i <  twist2; i++) {
            if (randomBright > 250) {
                stroke(255, 0, 0);
            } else {
            stroke(twist * 900 * sin(i), twist * 300, sin(i) * twist * 900);
            }
            vertex(twistSize * (cos(i) ** power), 
                   twistSize * (sin(i) ** power));
        }
        endShape();

        //second astroid 
        push();
        rotateZ(5);
        rotateX(3);
        rotateY(4);
        beginShape();
        noFill();
        for(var i = 0; i < twist2; i++) {
            stroke(twist * 300, twist * 900 * sin(i), sin(i) * twist * 900);
            vertex(twistSize * (cos(i) ** power), 
                 twistSize * (sin(i) ** power));
        }
        endShape();
        pop();

        //third astroid
        push();
        rotateZ(3);
        rotateX(4);
        rotateY(5);
        beginShape();
        noFill();
        for(var i = 0; i <  twist2; i++) {
            if (randomBright > 250) {
                stroke(255, 0, 0);
            } else {
            stroke(twist * 900 * sin(i), twist * 300, sin(i) * twist * 900);
            }
            vertex(twistSize * (cos(i) ** power), 
                   twistSize * (sin(i) ** power));
        }
        endShape();
        pop();

        //fourth astroid
        push();
        rotateZ(4);
        rotateX(3);
        rotateY(5);
        beginShape();
        noFill();
        for(var i = 0; i <  twist2; i++) {
            if (randomBright > 250) {
                stroke(255, 0, 0);
            } else {
            stroke(twist * 900 * sin(i), twist * 300, sin(i) * twist * 900);
            }
            vertex(twistSize * (cos(i) ** power), 
                   twistSize * (sin(i) ** power));
        }
        endShape();
        pop();

        //fifth astroid
        push();
        rotateZ(4);
        rotateX(3);
        rotateY(5);
        beginShape();
        noFill();
        for (var i = 0; i < 250 * TWO_PI; i++) {
            vertex(300 * (cos(i) ** power), 
                 300 * (sin(i) ** power));   
        }
        endShape();
        pop();
    }

    //third shape - Mimi's code 
    if (toggle === 3) {
        beginShape();
        noFill();

        //x and y coordinates
        var x;
        var y;
        var t = TWO_PI;
        var a = map(twist2, 0, width, 2, 10);
        var n = map(twist2, 0, height, QUARTER_PI, HALF_PI);
        var ma = map(a, 0, 200, 0, QUARTER_PI);

        //shape1
        push();
        beginShape();
        for(var i = 0; i < twist2; i++) {
            noStroke();
            fill(cos(twist2) * 100, cos(twist2) * 100, sin(twist2) * 100);
            x = a * sin(ma) * ((n - 1) * cos(t) + cos((n - 1) * t)) / n;
            y = a * sin(ma) * ((n - 1) * sin(t) - sin((n - 1) * t)) / n;
            vertex(-i * sin(i), i * cos(i), i);
            vertex(x, y);
            t += QUARTER_PI;
        }
        endShape();
        pop();

        //shape2
        push();
        beginShape();
        for(var i = 0; i < twist2; i++) {
            noStroke();
            fill(sin(twist2) * 100, cos(twist2) * 100, sin(twist2) * 100);
            x = a * sin(ma) * ((n - 1) * cos(t) + cos((n - 1) * t)) / n;
            rotateZ(-4);
            y = a * sin(ma) * ((n - 1) * sin(t) - sin((n - 1) * t)) / n;
            vertex(x, y);
            vertex(i * sin(i) , i * cos(i), i);
            t += HALF_PI;
        }
        endShape();
        pop();

        //accent shape3
        push();
        rotateX(frameCount * .003);
        rotateY(frameCount * .004);
        rotateZ(frameCount * .005);
        beginShape();
        for(var i = 0; i < twist2; i++) {
            noStroke();
            fill(sin(twist2) * 255, cos(twist2) * 255, sin(twist2) * 255);
            x = a * sin(ma) * ((n - 1) * cos(t) + cos((n - 1) * t)) / n;
            rotateZ(-4);
            y = a * sin(ma) * ((n - 1) * sin(t) - sin((n - 1) * t)) / n;
            vertex(x, y);
            vertex(i * sin(i) , i * cos(i), i);
            t += QUARTER_PI;
        }
        endShape();
        pop();
    }

    //SOPHIA KIM's code below
    // first "slide" for Sophia's Code - sphere 
    push();
    if (toggle === 4) {
        var radiusSphere1 = twisty2 * 200;
        fill(232, 0, 0);
        noStroke();
        rotateY(frameCount * twisty2 / 1000);
        rotateX(frameCount * twisty2 / 1000);        
        rotateZ(frameCount * twisty2 / 1000);
        sphere(radiusSphere1);

        var constrainR = constrain(mouseX, radiusSphere1, radiusSphere1);
        fill('yellow');
        noStroke();
        rotateY(frameCount * twisty2 / 500);
        rotateX(frameCount * twisty2 / 500);        
        rotateZ(frameCount * twisty2 / 500);
        sphere(constrainR);
    }
    pop(); 

    //first "slide" - lines behind the sphere
    push();
    if (toggle === 4) {
        for (var i = 0; i < twisty2 * 1000; i++) {
            stroke('red');
            beginShape();
            vertex(i * cos(i), i, i - 2000);
            vertex(i * .01, i * 0.09, i * .1);
            vertex(i * sin(i) , i * cos(i), i / 100);
            endShape(CLOSE);

            stroke('orange');
            beginShape();
            vertex(i * cos(i), i, i - 2000);
            vertex(i * .01, i * 0.05, i * .1);
            vertex(i * sin(i), i * cos(i), i / 500);
            endShape(CLOSE);
        }    
    }
    pop();

    //2nd "slide" for Sophia's code - lines 
    push();
    if (toggle === 5) {
        var Rfor2 = random(twisty2 * 140, 255);
        var Gfor2 = random(twisty2 * 140, 255);
        for (var i = 0; i < twisty2 * 3000; i++) {
            stroke(Rfor2, Gfor2, 230);
            strokeWeight(.4);
            beginShape();
            vertex(i * sin(i / 10), tan(sin(i / 20)) * 10); 
            vertex(i * sin(i / 20), sin(i / 100) * 20, cos(i / 50)); 
            vertex(tan(i / 10), cos(i / 100), cos(i * 100));
            vertex(sin(i / 20), tan(i / 50) * 40, sin(i * 5) / 20);
            endShape(CLOSE);
        }
    }
    pop();

    //3rd "slide" for Sophia's code - 
    //multiple circles moving around 
    push();
    if (toggle === 6) {
        for(var j = 0; j < 4; j++){
            var Rfor3 = random(twisty3 * 200, 255);
            stroke(Rfor3, 100, 240);
            for(var i = 0; i < twisty3 * 3000; i++){
                translate(sin(twisty3 * 0.4 + j) * 20, 
                          sin(twisty3 * 0.1 + j) * 20, i * 3);
                rotateX(frameCount * .3 / 5000 / twisty3);
                rotateY(frameCount * .2 / twisty3 / 100);
                rotateZ(frameCount * .5 / twisty3 / 300);
                push();
                sphere(14, 7, 5); 
                pop();
            }
        }
    }
    pop();
}

function mousePressed() {
    //reset to first shape/song after 6th song
    if (toggle < 6) {
        toggle ++;
    } else {
        toggle = 1;
    }

    //play songs based on mouse click sequence    
    if (toggle === 1) {
        sound1.play();
        sound6.stop();
    }

    if (toggle === 2) {
        sound2.play();
        sound1.stop();
    }

    if (toggle === 3) {
        sound3.play();
        sound2.stop();
    }

    if (toggle === 4) {
        sound4.play();
        sound3.stop();
    }

    if (toggle === 5) {
        sound5.play();
        sound4.stop();
    }

    if (toggle === 6) {
        sound6.play();
        sound5.stop();
    }
}


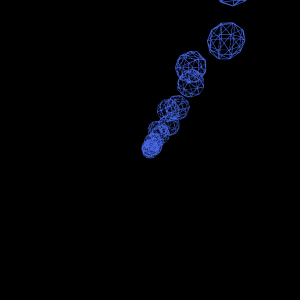
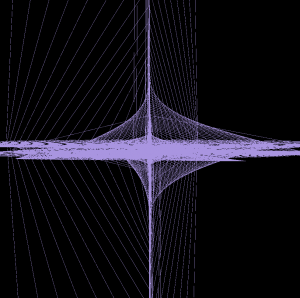
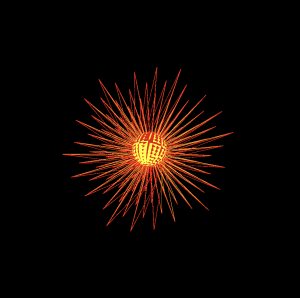
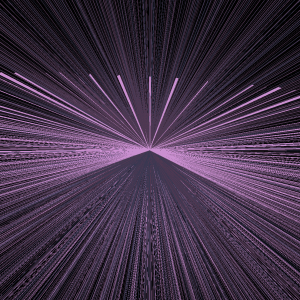
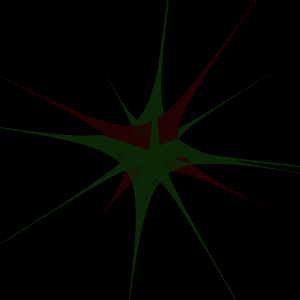
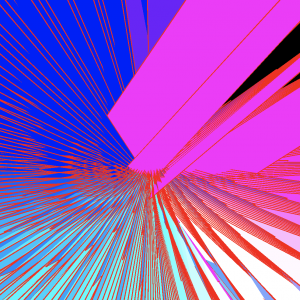
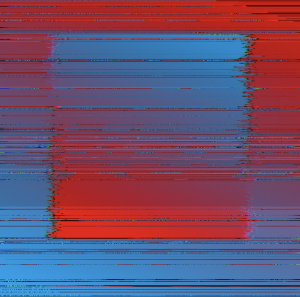
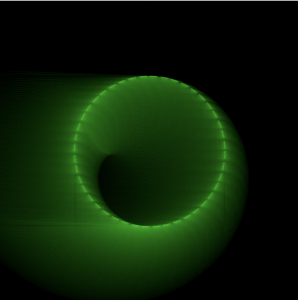
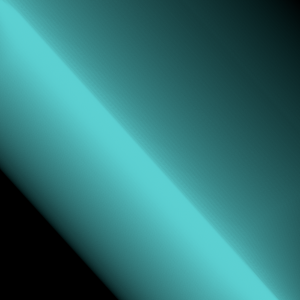
For the final project, we created various types of visuals that respond to different songs’ amplitude levels. We were interested in exploring how sound can be translated visually and wanted to challenge ourselves and try something new. So instead of using 2D, we decided to explore the basics of 3D with WEBGL.
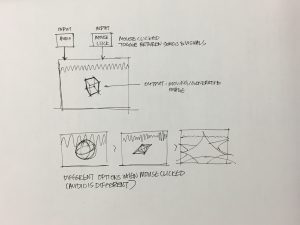
We wanted to further explore sound and graphics as one, so we wanted to directly tie the image of the graphics to the amplitude of the music playing. We used shapes like spheres, and beginShape/endShape to create the visuals and played around with implementing trigonometric functions to create curves and other shapes. We wanted to create something that the viewer could flip through, so we made this click-through visual presentation. By clicking on the mouse, the user is able to see different visuals each with its own song.
Have fun and we hope you enjoy it 🙂


Mimi Jiao – Looking Outwards 12 – Section E

Glitched image generated by pixel relocation via sound

I stumbled upon user avseoul on Vimeo while looking for the final project inspiration. Many of their works are create using Unity 3D and/or creative code to combine real time audio or video to alter the existing visuals on the screen. Avseoul uses a lot of organic shapes that mimics cells, mountains, and water droplets. Added with interesting textures and colors, they create really interesting graphics by integrating sound and visuals. I am really intrigued their glitched image by sound  and Audio Reactive Slit Photo-Scan Test where an image is taken and constantly reprocessed and altered based on a song that is playing. As the song continues to play, the image becomes more and more distorted and it’s an interesting way of visualizing the changes throughout the song. These alterations are almost a way of visualizing audio and it almost crosses into the domain of data visualization. I find this a really interesting starting point for one to explore deeper into ways information can be visualized. One thing I would like to see from this piece is how it translates into a three-dimensional space. I think it would be really cool if these changes were incorporated on the Z axis. These works provide a really interesting starting point for Sophia and me and we hope to branch off of these ideas and explore further into WEBGL.

Mimi Jiao – Project 12 Proposal – Section E

Sophia Kim and I plan on collaborating for this final project. We want to further explore interactive sound implementation and WEBGL. We started off exploring currently existing work and discovered code that integrates sound and visuals together. They utilized the frequency and amplitude of imported songs to alter the imported image. We started off looking at how static imported images are altered based off of sound with this video and we branched off static images by looking at more dynamic and generative shapes through WEBGL. We found this interactive particle to be really interesting and cool and we definitely want to play around with geometries. Since our current skillsets are not developed enough to create something as complicated and fleshed out as this particle equalizer, we want to stay confined to shapes like ellipses, boxes, and custom shapes generated by basic math functions like sin, cos, and tan. From this, we want to play around with the idea of interacting with multiple human senses to create an experience. The audience is able to have a more heightened experience because of the mix of visuals and audio. The use of sound can make visuals easier to comprehend. In a way, the visuals will almost be a method of data visualization of the structure of the song. 

Mimi Jiao – Looking Outwards 11 – Section E

Screencapture from Ryoji Ikeda’s datamatics 2006

Ryoji Ikeda is a sound artist primarily interested in generating sound tones and noise rather than instrumentals and voice. I am particularly interested in his audiovisual concert, Datamatics, which is an art project exploring making the intangible nature of data into something perceivable. Through a multisensory experience, Ikeda creates a soundscape generate based off of pure data. The soundtrack is jarring and almost hypnotic, with many layers and frequencies that create the feeling of being overwhelmed. Paired with the binary nature of the visuals, Ikeda presents a very accurate feeling of data and its presence in our lives. However, since I am viewing this work from a web page, I would like to know more about how this piece was incorporated into a physical environment and what other interactions were present within that space to enhance the communication of pure data.

Mimi Jiao – Project 11 – Section E

click to toggle between drawings

/*
Mimi Jiao
wjiao@andrew.cmu.edu
Section E 
Project 11
*/

var toggle = 0; //toggle between images drawn
var increment = 0; //increment for moving turtle and drawing turtle

function setup() {
    createCanvas(400, 400);
    background(0);
    
}

function draw() {

    //first drawing image
    if (toggle === 0) {
        for (var i = 0; i < 260; i ++) {
            var play = makeTurtle(cos(i) * 100 + 200, 200 + sin(i) * 100);
            play.penDown();
            play.setColor(color(0, 255, 0));
            play.right(increment);
            play.forward(increment);
        }
    increment += 1;
    if (increment > 850) {
        fill(0)
        rect(0, 0, width, height);
        increment = 0;
    }
    }

    //second drawing image
    if (toggle === 1) {
        for (var i = 0; i < 360; i ++) {
            var play = makeTurtle(width / 2, 200 + sin(i));
            play.penDown();
            play.setColor(color(255, 0, 0)); 
            play.left(increment);
            play.forward(increment);

        }
    increment ++;
    }

    //third drawing image
    if (toggle === 2) {
        for (var i = 1; i <= 800; i ++) {
            var play = makeTurtle(random(.1,.65) * 2**2 * cos(PI/i)/sin(PI/i),
                                    2**cos(PI/i)/sin(PI/i)
                );
            play.penDown();
            play.setColor(color(0, 0, 255));
            play.right(i);
            play.forward(i);
        }
    }

    //fourth drawing image
    if (toggle === 3) {
        for (var i = 0; i < 360; i ++) {
            //increment = map(mouseX, 0, windowWidth, 0, width);
            var play = makeTurtle(random(400), random(400) + sin(i));
            play.penDown();
            play.setColor(color(255, 0, 255)); 
            play.left(increment);
            play.forward(increment);
        }
    increment += 1;
    }

    //fifth drawing image
    if (toggle === 4) {
        for (var i = 1; i <= 800; i ++) {
            var play = makeTurtle(.45 * 2**2 * cos(PI/i)/sin(PI/i),
                                    2**cos(PI/i)/sin(PI/i)
                );
            play.penDown();
            play.setColor(color(0, 255, 255));
            play.right(increment);
            play.forward(increment);
        }
    increment += 1;
    if (increment > 950) {
        fill(0)
        rect(0, 0, width, height);
        increment = 0;
    }
    }

    //image reset back to black
    if (toggle === 5) {
        fill(0);
        rect(0, 0, width, height);
    }

}

//if mouse is pressed, toggle between the drawn images
function mousePressed() {
    toggle ++;
    if (toggle > 5) {
        toggle = 0;
    }

}

function turtleLeft(d) {
    this.angle -= d;
}
 
 
function turtleRight(d) {
    this.angle += d;
}
 
 
function turtleForward(p) {
    var rad = radians(this.angle);
    var newx = this.x + cos(rad) * p;
    var newy = this.y + sin(rad) * p;
    this.goto(newx, newy);
}
 
 
function turtleBack(p) {
    this.forward(-p);
}
 
 
function turtlePenDown() {
    this.penIsDown = true;
}
 
 
function turtlePenUp() {
    this.penIsDown = false;
}
 
 
function turtleGoTo(x, y) {
    if (this.penIsDown) {
      stroke(this.color);
      strokeWeight(this.weight);
      line(this.x, this.y, x, y);
    }
    this.x = x;
    this.y = y;
}
 
 
function turtleDistTo(x, y) {
    return sqrt(sq(this.x - x) + sq(this.y - y));
}
 
 
function turtleAngleTo(x, y) {
    var absAngle = degrees(atan2(y - this.y, x - this.x));
    var angle = ((absAngle - this.angle) + 360) % 360.0;
    return angle;
}
 
 
function turtleTurnToward(x, y, d) {
    var angle = this.angleTo(x, y);
    if (angle < 180) {
        this.angle += d;
    } else {
        this.angle -= d;
    }
}
 
 
function turtleSetColor(c) {
    this.color = c;
}
 
 
function turtleSetWeight(w) {
    this.weight = w;
}
 
 
function turtleFace(angle) {
    this.angle = angle;
}
 
 
function makeTurtle(tx, ty) {
    var turtle = {x: tx, y: ty,
                  angle: 0.0, 
                  penIsDown: true,
                  color: color(128),
                  weight: .005,
                  left: turtleLeft, right: turtleRight,
                  forward: turtleForward, back: turtleBack,
                  penDown: turtlePenDown, penUp: turtlePenUp,
                  goto: turtleGoTo, angleto: turtleAngleTo,
                  turnToward: turtleTurnToward,
                  distanceTo: turtleDistTo, angleTo: turtleAngleTo,
                  setColor: turtleSetColor, setWeight: turtleSetWeight,
                  face: turtleFace};
    return turtle;
}

I wanted to create something where you could toggle between states to see different drawings. I wanted to play with curves and spirals so I went back to mathworld.com to find some math equations.
Some process shots:

Mimi Jiao – Project 10 – Section E

sketch

/* Mimi Jiao
wjiao@andrew.cmu.edu
Section E 
Project 10
*/

var terrainSpeed1 = 0.00004;
var terrainSpeed2 = 0.00015;
var terrainDetail = 0.0024;
var trees = [];

function setup() {
    createCanvas(480, 300);

    //pushing trees into initial tree array 
    for (var i = 0; i < 10; i++){
        var rx = random(width);
        trees[i] = makeTree(rx);
    }
    frameRate(10);
}


function draw() {
    background(76, 101, 205); 

    //mountains in the back
    beginShape(); 
    stroke(78, 69, 94)
    for (var x = 0; x < width; x++) {
        var t = (x * terrainDetail) + (millis() * terrainSpeed1);
        var y = map(noise(t), 0,1, height / 2, height / 5);
        line(x, y, x, height * 9 / 12);

    }
    endShape();

    //mountains in the front
    beginShape();
    stroke(55, 55, 81)
    for (var x1 = 0; x1 < width; x1++) {
        var t1 = (x1 * terrainDetail) + (millis() * terrainSpeed2);
        var y1 = map(noise(t1), 0,1, height / 4, height / 1.5);
        line(x1, y1, x1, height * 9 / 12);

    }
    endShape();
    
    //horizon line
    fill(36, 36, 42);
    rect(0, height * 9 / 12, width, height / 4);

    updateTrees();
    removeTrees();
    randomTrees();

    //wall fill
    noStroke();
    fill(38, 44, 62);
    rect(0, 0, width, height / 5);
    rect(0, 0, width / 10, height);
    rect(0, 4 * height / 5, width, height / 5);
    rect(9 * width / 10, 0, width / 10, height);

    //WINDOW 
    noFill();
    rectMode(CORNER);
    rect(width / 10, height / 5, width * 8 / 10, 3 * height / 5);
    fill(70, 90, 140);
    noStroke();
    rect(width / 10 - 10, height / 5, (width * 8 / 10) + 20, height / 40);
    rect(width / 10 - 10, height * 4 / 5, (width * 8 / 10) + 20, height / 40);
    rect(width / 10 - 10, height / 5, 10, 185);
    rect(width * 9 / 10, height / 5, 10, 185);
    push();
    rectMode(CENTER);
    rect(width / 2, height / 2 + 5, (width * 8 / 10) + 20, height / 40);
    rect(width / 2, height / 2 + 5, 10, 185);
    pop();   
}

//update tree location after moving them and display them
function updateTrees(){
    for (var i = 0; i < trees.length; i++){
        trees[i].move();
        trees[i].display();
    }
}

//if trees fall out of the viewing window, remove from array
function removeTrees() {
    var treesToKeep = [];
    for (var i = 0; i < trees.length; i++) {
        if (trees[i].x + trees[i].breadth > width / 10) {
            treesToKeep.push(trees[i]);
        }
    }
    trees = treesToKeep;

}

//randomly generate trees
function randomTrees() {
    var newTreeProbability = .03;
    if (random(0,1) <= newTreeProbability) {
        trees.push(makeTree(width));
    }
}

//move the trees
function treeMove() {
    this.x += this.speed;
}

//display and draw the trees
function treeDisplay() {
    var treeHeight = -height * 4 / 12;
    fill(255); 
    noStroke(); 
    push();
    translate(this.x, height);
    fill(71, 91, 73);
    //tree body and leaves
    triangle(0,(-height * 3 / 12) + 5,
             20, (-height * 3 / 12) + 5,
             10, treeHeight + this.height);
    //tree log
    noStroke();
    fill(106, 91, 82);
    rect(8, (-height * 3 / 12) + 5, 5, 6);
    stroke(200); 
    pop();
}

//create the tree
function makeTree(birthLocationX) {
    var tr = {x: birthLocationX,
                breadth: 20,
                speed: -3.5,
                height: random(-25, 10),
                move: treeMove,
                display: treeDisplay}
    return tr;
}

One of my deepest memories is of myself looking out of a moving train at night in the deserts of north-central China. I wanted to recreate the feeling of watching mountains pass by when the sun has just set. I initially explored both a vertical and horizontal composition, but I ultimately ended up with the landscape view. At the end, I changed a train window to a regular window because I thought it was more intuitive to understand. Here’s a picture of my initial sketches:

Mimi Jiao – Looking Outwards 10 – Section E


Claudia Hart, Inside the Flower Matrix, 2017

Claudia Hart is a new media artist who emerged as a part of the identity art movement. Her works center around observing identity, perception, and the physical being through the lens of technology. A work I particularly was interested in is virtual reality environment and sound installation Inside the Flower Matrix, 2017. This piece is a play on Alice in Wonderland in the digital age, where rationality and technology goes off-rail. There are multiple parts of this piece where viewers can experience it through a virtual reality app by pointing their camera at the artwork. In addition to the digital version, there are also hand thrown ceramics, quilts, wallpaper to accompany the experience. I am really impressed by the way that she has brought a digital environment into the real world and added instances of tangibility to further emphasize her idea. The way she has integrated items that the user can interact with and experience through touch and sound really drives her idea of the integration of technology with the human body. I really wish I could visit the real site installation of this piece – the online experience of this piece is nowhere as representative as it would be in the real space. It would be interesting to see her build a web and digital experience off of this piece.

Mimi Jiao – Looking Outwards 9 – Section E

Ryoji Ikeda, data.path in Madrid

I really enjoyed Sophie Chen’s Looking Outwards 4, where she talked about computational musical artist Ryoji Ikeda. He specializes in creating sounds based on data and his works are a form of data visualization. In Ikeda’s work data.path, I agree with Sophie’s point that audio and visual perception are intertwined and are integral to each other’s perceptions. I, too, am interested in how the two tie together to create an environment. I am really intrigued by data.path specifically because the darkness of the installation space, paired with the visuals and audio, creates a sense of spatial dimension even when the user is standing still. The lack of light in the space dulls the viewer’s sense of perception and they become more receptive to the audio and visual installation. I am really interested in this experience and I would love to experience it first hand. Ikeda’s work demonstrates the strength audiovisual elements have on the experience and perception of a space, and his work perfectly demonstrates ways computation can be applied to artistic rendering.

Mimi Jiao – Project 9 – Section E

try clicking me!

/* Mimi Jiao
wjiao@andrew.cmu.edu
Section E
Project-09
*/

var underlyingImage;
var clickCount;    
var string = "0";

function preload() {
    //preloading image into code 
    var myImageURL = "https://i.imgur.com/kkJQot1.jpg";
    underlyingImage = loadImage(myImageURL);
}

function setup() {
    //setting size of canvas to image size 
    createCanvas(underlyingImage.width, underlyingImage.height);
    background(0);
    underlyingImage.loadPixels();
    frameRate(300);
}

function draw() {
    strokeWeight(1);
    //finding color and location of the image
    var px = random(width);
    var py = random(height);
    var ix = constrain(floor(px), 0, width-1);
    var iy = constrain(floor(py), 0, height-1);
    var theColorAtLocationXY = underlyingImage.get(ix, iy);
    noFill();
    stroke(1);
    //setting up font size and type
    textSize(10);
    textFont('Courier New')
    stroke(theColorAtLocationXY);
    text("m i mi", px, py);
}

function mousePressed() {
    //if mouse is pressed, add these elements to the canvas
    textSize(20);
    //randomizes click count so that if it lands on a 
    //certain value, then something different will display
    clickCount = int(random(20));
    if (clickCount % 5 === 0) {
        strokeWeight(2);
        stroke(0, 255, 0);
        fill(255, 0, 0)
        string = "1";
    }else if (clickCount === 17) {
        strokeWeight(3);
        stroke(0, 0, 255);
        string = "error";
    }else {
        string = "0";
    }
    fill(255, 0, 0);
    text(string, mouseX, mouseY);

}

For this project, I was inspired by binary numbers and the primitive visuals of computer errors and coding. I used a picture I took of myself during the summer in a bathroom, adjusted the colors and made parts of it neon green to fit the aesthetic a bit more, and used my name, “mimi” to generate the image.
Here is the original image:

Here is the generated image:

Mimi Jiao – Looking Outwards 8 – Section E

Eyeo 2016 – Kyle McDonald from Eyeo Festival on Vimeo.

Kyle McDonald is an artist, philosopher and computer scientist whose artistic medium consists mainly of code. He is heavily involved in creating and collaborating on initiatives that blend engineering with art and through that he hopes to bring connectivity to visual processing and computer libraries. He specializes in new media and uses coding systems such as openFrameworks to create systems with elements of playfulness. His works mainly revolve around the idea of interaction and visualization through code – many of his works adhere to his visual brand of glitchy aesthetics. However, he has also created many larger and higher fidelity works including installation and performance art. I admire his works because it very clearly shows his exploration in having fun and pushing the boundaries of what coded art can become. His smaller scale works like the glitchy renderings are the ones that I personally enjoy the most from an aesthetic standpoint, and it is something I have been trying to render throughout this course. Since creating these glitchy graphics don’t necessarily take up a lot of resources and is very accessible, I want to really try and push myself to see what I can create. His larger installations, like Social Soul, are also works I really respect and appreciate. Many of his installations emerge the visitor in a whole-body experience where the digital and physical come together to create a hybrid experience. These two worlds come together and the perception of space, time, and physicality is heavily altered. I really enjoy this type of isolation and eeriness that McDonald’s installations create and it pushes me to ponder the influence of technology on the physical existence of all matter. Especially in this hybrid age with the integration of digital and physical experiences, it is really interesting to see McDonald’s take on bringing coding into real life. If I ever had access to the resources to make large scale installations like these, I would love to design experiences that play on the idea of blurring the line between reality and the digital realm.