![[OLD FALL 2018] 15-104 • Introduction to Computing for Creative Practice](https://courses.ideate.cmu.edu/15-104/f2018/wp-content/uploads/2020/08/stop-banner.png)

Nicholas Feltron is a designer and artist whose work centers around exploring different ways of information visualization and translating data into meaningful and digestible experiences. He is widely known for his multi year project, the personal annual reports. In this personal annual reports, he summarizes his yearly activities in a series of graphic representations. These statistics track his living habits such as amount of time spent sleeping, working, relaxing, etc. as well as information about the external environment such as weather. I found out about him last year through my design professors and I was really interested in how he used Processing to map out his information in a visually interesting way. Since he collects a ton of information everyday, he uses coding to filter out unnecessary data and find patterns within the data. I really enjoy the layout and visual elements of his annual reports; they are very readable and easy to understand. It’s interesting seeing him map out his own behaviors as well as the environment’s behaviors through bar graphs, population density clusters, and other information visualization techniques. In addition, it is also really easy for viewers to jump to specific sections of his report since there is an overwhelming amount of information throughout the entire report. His use of colors unify his report and adds emphasis to the information he wants to highlight. All in all, Feltron’s annual reports demonstrate the effectiveness of creative coding while maintaining good design conventions for optimal information digestion. As a piece of design, I think it is very interesting and effective, however, his reports don’t really explore the aesthetics of information visualization as much. There are probably much more interesting and fun ways of visualizing the data in his annual report. But, I really enjoy this for the content of the work rather than the aesthetics, and I think it is really interesting seeing someone’s life represented through numbers, graphs, and text.
Author: Mimi
Mimi Jiao – Project 7 – Section E
/*
Mimi Jiao
wjiao@andrew.cmu.edu
Section E
Project 7
*/
var mousepress; //boolean for switching states in mousePressed()
var r = 255; //initial color variable
var power = 33; //exponent for astroid functions
var scaleFactor = 1; //scaling elements variable
var increaseScale = .01; //variable for if statement in altering scale
function setup() {
createCanvas(480, 480, WEBGL);
background(0, 0, 255);
}
function draw() {
background(0, 0, 0);
strokeWeight(random(.4,.6)); //random strokeweight for jitter effect
stroke(0, 0, 255);
//drawing the rainbow background
push();
translate(0, 0, -100);
drawBG();
pop();
//drag mouse to rotate astroids around X and Y axis
if (mouseIsPressed) {
rotateX(mouseX * .01);
rotateY(mouseY * .013);
}
//rotate astroids
rotateZ(frameCount * .02);
rotateX(frameCount * .001);
rotateY(frameCount * .01);
stroke(0, 0, 255);
ellipsoid(25, 25, 25); //center ellipsoid
stroke(0, 255, 0);
scale(scaleFactor); //scaling the astroids
//constantly scales up and scales down the astroids
if (scaleFactor < 5 & scaleFactor >= 1) {
scaleFactor += increaseScale;
}else if (scaleFactor >= 5) {
increaseScale = -increaseScale;
scaleFactor += increaseScale;
}else if (scaleFactor === .99) {
increaseScale = -increaseScale;
scaleFactor = 1;
}
//drawing the astroids & rotating them to form a spike
drawAstroid();
push();
rotateZ(5);
rotateX(3);
rotateY(4);
drawAstroid2();
pop();
push();
rotateZ(3);
rotateX(4);
rotateY(5);
drawAstroid2();
pop();
push();
rotateZ(3);
rotateX(4);
rotateY(5);
drawAstroid();
pop();
push();
rotateZ(4);
rotateX(3);
rotateY(5);
drawAstroid();
pop();
push();
rotateZ(4);
rotateX(3);
rotateY(5);
drawAstroid2();
pop();
}
//first draw astroid function
function drawAstroid() {
mappedMouseX = map(mouseX, 0, width, 0, 12);
beginShape();
noFill();
for(var i = 0; i < 250 * TWO_PI; i ++) {
stroke(0 , 255, 0);
vertex(300 * (cos(i)**power),
300 * (sin(i)**power));
//changes color of astroid based on mouseY
if (mouseY >= height / 2) {
stroke(r , 0, 0);
}
}
endShape();
}
//second draw astroid function (different color)
function drawAstroid2() {
mappedMouseX = map(mouseX, 0, width, 0, 12);
beginShape();
noFill();
for(var i = 0; i < 250 * TWO_PI; i ++) {
stroke(-r , 255, r);
vertex(300 * (cos(i)**power),
300 * (sin(i)**power));
}
endShape();
}
//drawing the rainbow background
function drawBG() {
push();
for (var i = 0; i < 1000; i++) {
noFill();
stroke(i * sin(i) + 455, i * cos(i), sin(i) * width);
beginShape();
vertex(sin(i) * 900, cos(i) * 900,
sin(i)* 900);
vertex(sin(i) * 850, cos(i) * 850,
cos(i) * 850);
vertex(cos(i), sin(i), sin(i));
endShape(CLOSE);
}
pop();
}
//if mouse is pressed, change color of specific astroids
function mousePressed() {
if (mousepress === true) {
r = random(20, 255);
} else {
r = 255;
}
mousepress = !mousepress;
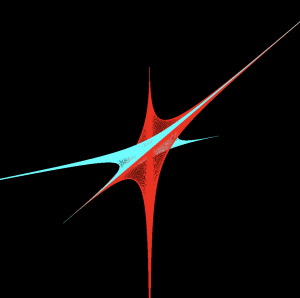
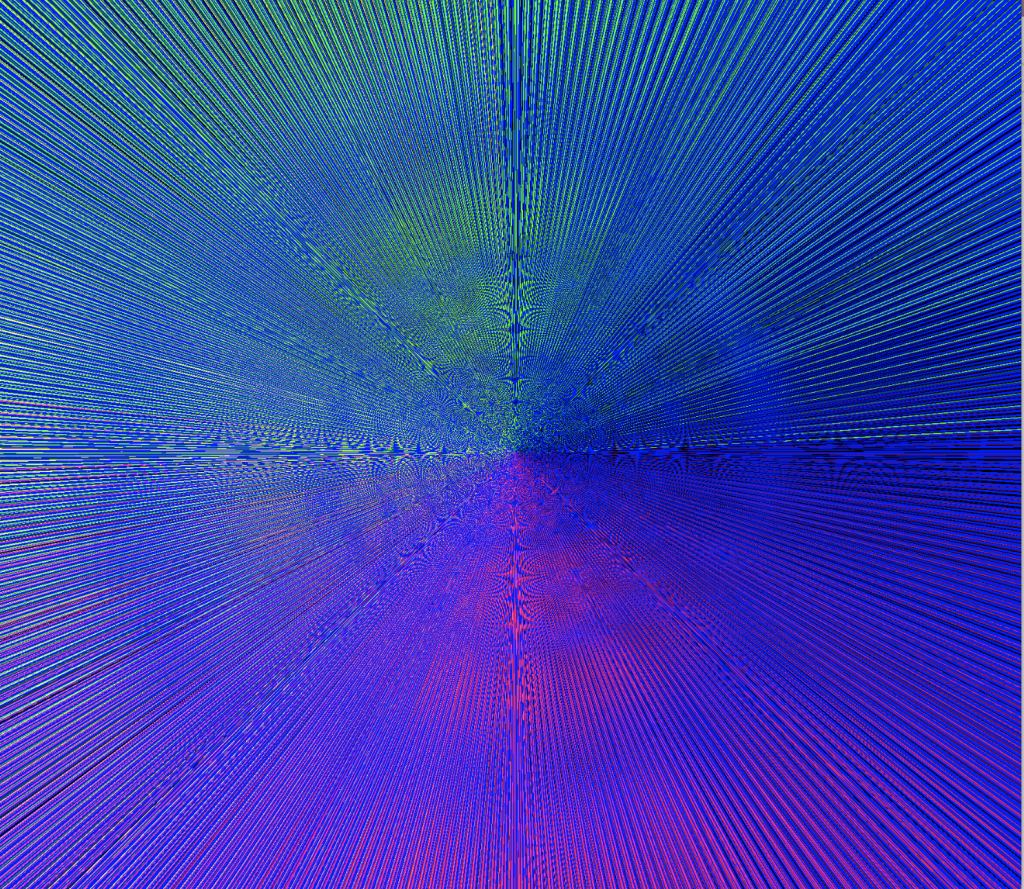
}I wanted to continue along the same path as I did for my project last week by using WEBGL again. This time, I really wanted to create a more 3D object that didn’t only exist on one plane, so I tried to play around with rotating the X, Y, and Z axis for the astroids. For this project, I utilized the mousePressed function and mouseIsPressed to play around with interaction. Here are some of my previous explorations below.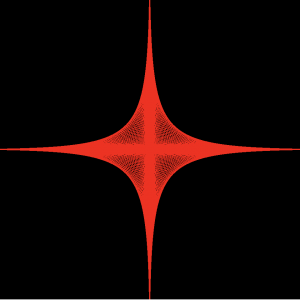
Mimi Jiao – Project 6 – Section E
/*
Mimi Jiao
wjiao@andrew.cmu.edu
Section E
Project-06
*/

function setup() {
    createCanvas(480, 480, WEBGL);
}

function draw() {
    var H = hour();
    var M = minute();
    var S = second();
    background(0, 0, 255);
    rotateZ(frameCount * .01);

    //in this for loop, as the seconds increase,
    //the number of "fan" components within this shape increases
    for (var i = 0; i < S * 100; i++) {
        noStroke();
        fill(i * sin(i), i * cos(i), sin(i) * 200);
        beginShape();
        vertex(sin(i) * 1000, cos(i) * 1000, sin(i) * 1000);
        vertex(sin(i) * 1010, cos(i) * 1010, cos(i) * 1010);
        vertex(cos(i), sin(i), sin(i));
        endShape(CLOSE);
    }

    //size of sphere depends on the minute
    push();
    rotateX(frameCount * .005);
    rotateZ(frameCount * .01);
    for (var a = 0; a < M; a++) {
        noFill();
        strokeWeight(.4);
        //stroke color of sphere
        stroke(sin(radians(M)) * 255, sin(radians(M)) * 255,
               sin(radians(M)) * 255);
        //Scales the size of the sphere for aesthetic purposes
        var mMap = map(M, 0, 60, 10, width);
        ellipsoid(mMap , mMap , mMap );
    }
    pop();

    push();
    //scales the hour by two for aesthetic purpose
    H *= 2;
    //rotates the shapes
    rotateX(frameCount * .05);
    rotateY(frameCount * .01);
    //loop drawing continuous geometric elements
    for (var p = 0; p < H * 50; p ++) {
        //constantly changes color of stroke based on time/sin
        stroke(200 + 25 * sin(millis() / 1000),
             200 + 25 * sin(millis() / 1000 + HALF_PI),
             200 + 25 * sin(millis() / 1000 - HALF_PI));
        strokeWeight(.5);
        noFill();
        //changing origin so object moves across page
        translate(sin(H) * 24, sin(H) * 24, H);
        //coordinates for drawn geometric shape
        beginShape();
        vertex(p * cos(p) * .1, H * 10 * cos(p), .1 * (p - 1000));
        vertex(p* .01 * .1, p* 0.1 * .1, p*.01 * .1);
        vertex(p * sin(p) * .1, .1 * p * cos(p), 10 * H);
        vertex(p * cos(p + PI) * .1, H * 10 * cos(p + PI), .1 * (p - 1000));
        vertex(p * sin(p + PI) * .1, .1 * p * cos(p + PI), .1 * H);
        endShape(CLOSE);
    }
    pop();
}
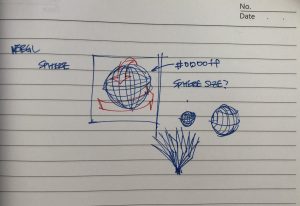
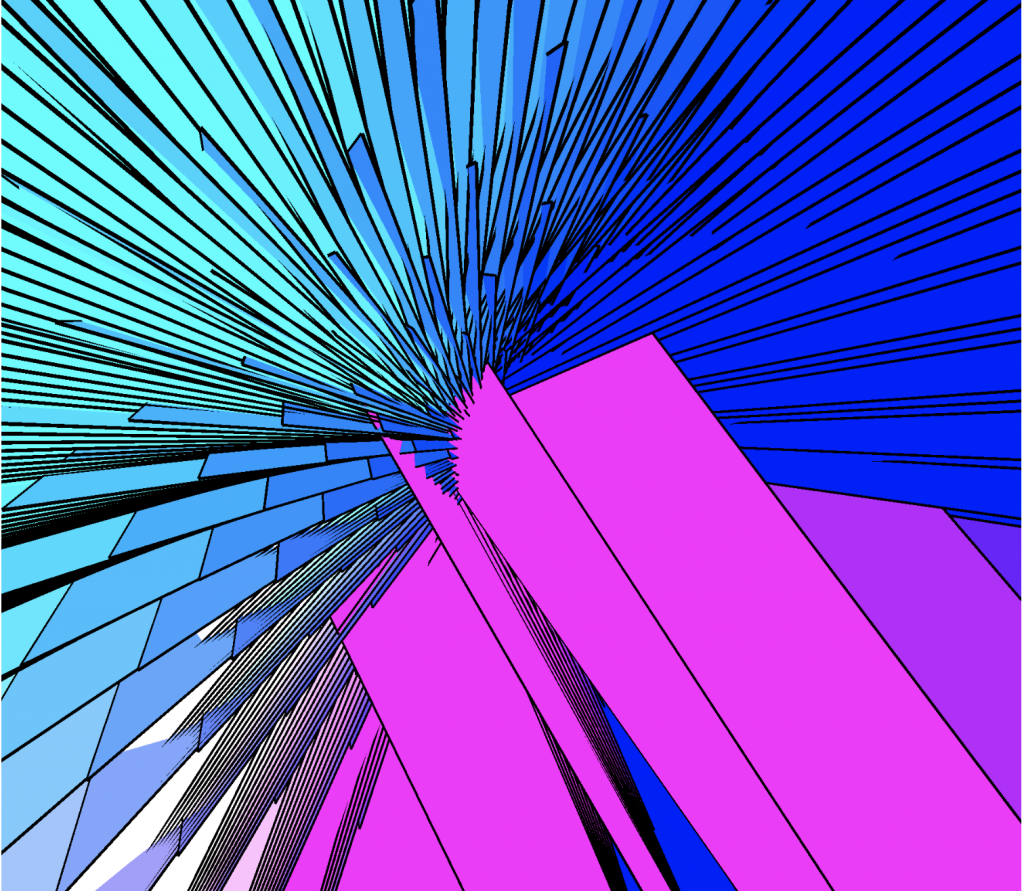
I’ve always wanted to play around with WEBGL and seeing Jenny Hu’s clock project pushed me to use it for this assignment. I started out checking out primitive 3D functions like translate, ellipsoid and box to get a better understanding of how it works. I also wanted to explore how to make optical art, so I checked out different math functions in for loops. I played around with trig functions to see how shapes would be affected and also messed around with incorporating the mouseX function into for loops to alter the shape of the shapes I made. After experimenting, I went back into incorporating the ellipsoid to represent time because it was most fitting for my skill level. I initially wanted to do something more complex but I couldn’t quite figure out how to create it using vertex points.
My approach to the abstract clock isn’t very visually intuitive but I wanted to explore mapping time using different math functions in WEBGL.
Mimi Jiao – Looking Outwards 6 – Section E

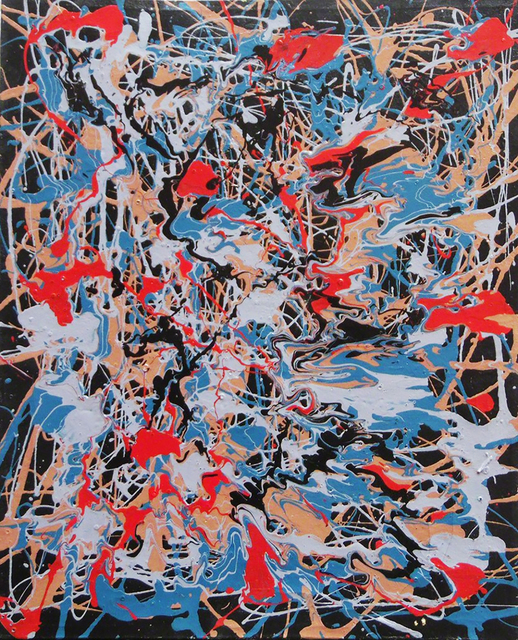
Janet Sobel was an abstract expressionist painting whose works drew directly from Jackson Pollock’s drip painting techniques. Although her career was short lived, she created many well known pieces that have very interesting repetition of form and texture. Like Pollock, she used unconventional materials to create the drip effect, including glass pipettes and enamel paint. The drip painting technique is uses biased randomness. The drip of the painting is controlled by controlled and constant variables such as gravity, speed of paint drip, and acceleration, but since it is done so freehandedly, the amount of paint and the technique of the paint drip are highly influenced by the constant variables in ways that are extremely hard to control precisely. This creates randomness in the painting. Although the art is preplanned, a variety of environmental and other factors will affect the way the piece turns out, which makes it random. Of her works, I really appreciate this piece and this piece, which are both untitled. Having seen so much of Pollock’s drip paintings in mainstream media, it is very refreshing to see different artists’ interpretations of the same technique. I love that Sobel’s paintings have more of a sense of fluidity to them. The contrast of thick and thin, the pools of paint, and the overlapping of different colors creates a very free flowing liquidity that I really enjoy. It reminds me of opp art and psychedelic patterns, especially with the bright colors and stark contrast between colors. All of these visual elements combine together to generate visual flow and allows my eye to explore the piece from one point to another. It begins to create a narration for my brain to comprehend, and I find myself not overwhelmed with choosing a place to start looking, which is what I often experience when looking at Pollock’s work. One thing I wish I could see more of is the use of different colors. Sobel’s drip paintings almost always use red, black, and white, and I wish there were more works like the first one that explores more types of color interaction. It would also be nice if there were more contextual information about her works; I found it hard to understand her purpose for creating art with the lack of information on the internet. However, I really enjoy her take on the randomness of drip painting and I prefer it over Pollock’s works.
Mimi Jiao – Project 5 – Section E
/*
Mimi Jiao
wjiao@andrew.cmu.edu
Section E
Project-05
*/
var h = 5;
var w = 25;
var gap = 5;
function setup() {
createCanvas(400, 400);
}
function draw() {
background(0, 0, 255);
//adds an extra interactive element so that the wallpaper
//changes as the mouse is held and dragged
if (mouseIsPressed) {
w = mouseX / 10;
h = mouseY / 10;
}
//draws vertical rectangles in the for loop
for (var y = 0; y < 40; y ++) {
//draws horizontal rectangles in every quarter of the canvas
for (var x = 0; x < 4; x ++) {
//white longer rectangles
push();
noStroke();
rect(x * (width / 4), y * (h + gap), w, h);
pop();
//empty fill green outline longer rectangles
push();
noFill();
stroke(0, 255, 0);
rect(w + (x * width / 4), gap + (y * (h + gap)),
w, h);
pop();
//red fill longer rectangles
push();
fill(255, 0, 0);
rect((3 * w / 2) + (x * width / 4),
y * (h + gap), w, h);
pop();
//black fill shorter rectangles
push();
fill(0);
rect(w * 3 + (x * width / 4), gap + (y * (h + gap)),
w / 2, h);
pop();
}
}
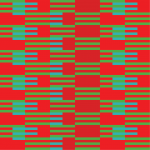
}This project was an extension of one of my past projects for another class I’m taking, Color for Communciations, Products, and Environments. For that project, I created a repeating grid on Adobe Illustrator and made many different versions of it with different colors to study color interactions. I wanted to apply the same idea this time using code as my medium of expression, which allows me to play with more colors using the RGB colorspace that the CMYK colorspace doesn’t cover. In addition, it lets me play around with the interactive mouse, a function I really enjoy using.
Mimi Jiao – Looking Outwards 5 – Section E

Created using custom algorithm derived from repetition in nature
Yoichiro Kawaguchi is a well known pioneer in the field of Computer Graphics since 1975. He is best known for his “GROWTH Model” and “metaballs,” which are algorithms that he developed from growth patterns in natural forms like shells and plants. These algorithms have helped him create and animate many life-like and fluid-like forms through coding. Although created in the 1900s, I am really intrigued by his algorithm generated works such as Eggy (1990) and Festival (1991). First off, the colors and texture of the works really capture my attention. I personally really enjoy a wide range of bright, saturated, and neon colors, and his work perfectly includes those colors. In addition, through his algorithms, he creates a very life-like and three-dimensional structure that almost pops out of the page. Eggy in particular embodies this three dimensionality really well, as it looks like the shapes are reflecting light. Each element is rendered with such attention to detail and nothing is left unfinished. The colors and texture perfectly transitions into one another. His other piece, Festival, continues on the same trail of colors, but this time, he took a more primitive approach to rendering the elements. Kawaguchi left out most of the reflective quality in Eggy and began to explore creating depth through contrast of form, contours, and colors. This really caught my attention as I am also currently experimenting with creating three dimensionality through contrast in color and form. Overall, his pieces really give off a psychedelic vibe and I am left wanting to see more. Something I want to see more of is how he would approach these works in the current time. He has definitely been able to develop his algorithms more and I want to see how he would interpret these past works with his current skillset and code. In addition, since many of his pieces are quite old, I want to see how they would look animated. Eggy and Festival already look so three dimensional; it would be crazy to see how that would translate when these elements are visualized traveling through time and space. These works really inspire me and it is close to what I want to create, so I would love to see more of his work as well as his process.
Mimi Jiao – Looking Outwards 4 – Section E
LandFilles exhibition in Experimental Intermedia, NYC on 6/20/2009
LandFilles at Emily Harvey Foundation in 2013
Keiko Uenishi is an experimental sound art-i-vist, socio-environ composer, and core member of SHARE, an organization that promotes and supports new media communities. She is most known for her installations playing around sound in physical environments. I am particularly intrigued by her work-in-progress live presentation, LandFilles. In collaboration with Katherine Liberovskaya, who took part in creating the video environment and live video, this piece explores the recycling feedback system in the city and upcycling movement. The project consists of three phases: first, empty clear plastic bottles are collected from streets and visitors; second, these bottles are formed into an installation by visitors which is then accompanied by audiovisual live projections; lastly, the structure is destroyed and given away to visitors. What attracted me the most about this is that the installation is ever-changing. In each exhibition space, it is different and generated by those who visit and interact with it. Each experience by each visitor is unique, and although the core idea is the same, the live process differs across different exhibition spaces and becomes more personalized. Since materials are collected locally, it makes the experience even more close to home and relatable for the visitors. This creates an interactive and immersive piece in which visitors become part of the artwork. As someone who is really interested in interactive 3D installations, I really want to physically experience this piece. Something I would like to see more of is the integration of these recycled materials with the physical space of the gallery itself. I think it would be interesting if there was some way of designing user flow throughout the gallery space to enhance the experience, possibly using sensors to give visitors more external stimuli, such as smell and touch. Overall, this is a really interesting piece and it really uses generative sound well with the subject matter and experience.
Mimi Jiao – Project 4 String Art – Section E
check out the mouse click~
sketch
var x; //increment variable for width for bottom curves
var y; //increment variable for height for bottom curves
var a; //increment variable for width for top curves
var b; //increment variable for height for top curves
var angleIncrement; //location for where to draw line in circle
var r; //radius of the center strings forming circle

function setup() {
    createCanvas(400, 300);
}

function draw() {
    background(0);
    x = width / mouseX * 5;
    y = height / mouseY * 5;
    a = width / mouseY * 10;
    b = height / mouseX * 10;
    angleIncrement = mouseX / 100;
    r = width;

    //center circle
    if (mouseIsPressed) {
        for(var angle = 0; angle < 360; angle += mouseX / 100) {
            stroke(0, 0, 255);
            push();
            translate(width / 2, height / 2);
            line((r * sin(angle)) / tan(angle),
                  r * sin(angle),
                  r * sin(angle + angleIncrement) / tan(angle + angleIncrement),
                  r * sin(angle + angleIncrement));
            pop();
        }
    }

    //drawing the four curves on each corner of the canvas
    for(var i = 0; i < 50; i ++) {
        strokeWeight(1);

        //draws the first 20 red lines on the bottom left corner
        //draws green lines for the rest
        if (i >= 30) {
            stroke(0, 255, 0);
            line(0, y * i, x * i, height);
        }else {
            strokeWeight(1);
            stroke(i * 30, 0, 0);
            line(0, y * i,  (x * i), height);
        }

        //red on bottom right hand side
        //stroke(255,0,0);
        stroke(i * 15, 0, 0);
        line(width, y * i, width - (x * i), height);

        //color changing curves on top
        stroke(mouseX, 0, 255);
        line(0, height - (a * i), b * i, 0);
        line(width - (b * i), 0, width, height - (a * i));
    }
}
I first started out making the most basic curve. After that, I began building symmetries and color changes into the code to make it more interactive and fun. Figuring out the circle took me a while since I haven’t touched math ever since junior year in high school, but the result was rewarding and I had a lot of fun doing so.
Mimi Jiao Looking Outwards 3

Andrew Kudless, a designer and professor as well as the founder of the design firm Matsys, has created many generative physical and digital works. His creative interest lies in the manipulation of form, growth, and behavior in materials and their intertwining qualities of all of them in a system. This interest is clearly shown in his work P_Wall (2013), created first using software generated designs in Grasshopper, Rhino, and Kangaroo, and then translated into physical form through using a thin-shell concrete fabrication process that consisted in the use of fabric-cast plaster patterns and rubber molds. The initial form of this piece is what attracted me instantly. The design appeals to me on an intuitive and emotional level – the smooth curves tell me to get closer to it. It pulls me in and makes me want to touch it and bury my body in it. The irregularity in form is perfected through slight variations and inconsistencies throughout the installation while maintaining the core structure throughout. It begins to take me to somewhere familiar, and brings me to think of trees, or some other type of organic form. I admire his work because he is able to evoke the sense of familiarity and comfort in forms while using materials and fabrication methods that are typically not associated with such feelings. One thing that I would like to see more of is P_Wall (2013) in real time. I think this piece would be interesting as a time-based installation, where we can see people in the space interacting with the piece. It would be interesting to see how his exploration of form affects others from an emotional standpoint. Would people be like me and walk up to the work to touch and experience it? How and what aspects of the form appeal to people and what parts repels people? For me, I would definitely interact with this piece if it was presented in my life. It would be great to experience the physical qualities of something generated by computers; it is the coming together of digital and physical environments.
Mimi Jiao Project 3 Dynamic Drawing
var defaultBG = 0;
//to inverse line/background colors when key is pressed
var whiteLines = 255;
var blackLines = 0;

function setup() {
    createCanvas(640, 480);
}

function draw() {
    background(defaultBG);
    //changes background color when mouse hovers over top/bottom of page
    if (mouseY >= 3 * height / 4) {
        background(255, 0, 0);
    }else if (mouseY <= height / 4) {
        background(0, 0, 255);
    };
    noFill();
    stroke(0, 255, 0);
    strokeWeight(1);
    ellipse( width / 2, height / 2, 50, 50);
    //green rectangle going across page
    fill(0, 255, 0);
    noStroke();
    rect(mouseX - width * .75, 50, 250, 10);
    noFill();
    strokeWeight(1);
    stroke(whiteLines);
    //three swinging lines
    line(width - mouseX, 130, 30, 50);
    line(width - mouseX + 30, 140, 30, 50);
    line(width - mouseX + 60, 150, 30, 50);
    //change color of rectangle outline and make text appear
    //if mouse is pressed
    if (mouseIsPressed) {
        strokeWeight(2);
        stroke(255, 54, 258);
        stroke(whiteLines);
        strokeWeight(.5);
        textFont('Courier New');
        text("ok ok ok ok ok ok ok", 50, 100);
        stroke(255, 54, 258);
    };
    //vertical lines on top
    strokeWeight(1);
    rect(width / 4, 100, 50, 70);
    stroke(whiteLines);
    strokeWeight(1);
    line(500, mouseY, 500, mouseY + 200);
    line(505, mouseY, 505, mouseY + 200);
    line(510, mouseY, 510, mouseY + 200);
    line(515, mouseY, 515, mouseY + 200);
    line(520, mouseY, 520, mouseY + 200);
    line(525, mouseY, 525, mouseY + 200);
    line(530, mouseY, 530, mouseY + 200);
    line(535, mouseY, 535, mouseY + 200);
    line(540, mouseY, 540, mouseY + 200);
    //vertical lines on bottom
    stroke(0,255,0);
    line(502, mouseY * 1.5 + 150, 502, mouseY * 1.5 + 410);
    line(507, mouseY * 1.5 + 160, 507, mouseY * 1.5 + 480);
    line(512, mouseY * 1.5 + 170, 512, mouseY * 1.5 + 480);
    line(517, mouseY * 1.5 + 180, 517, mouseY * 1.5 + 480);
    line(522, mouseY * 1.5 + 190, 522, mouseY * 1.5 + 480);
    line(527, mouseY * 1.5 + 200, 527, mouseY * 1.5 + 510);
    line(532, mouseY * 1.3 + 50, 532, mouseY * 1.3 + 510);
    line(537, mouseY * 1.3 + 50, 537, mouseY * 1.3 + 510);
    //thin rectangle blocks moving across page on bottom
    noStroke();
    fill(whiteLines);
    rect(width - mouseX, 400, 100, 5);
    rect(width - mouseX * 1.5, 400, 60, 5);
    rect(width - mouseX * 2.5, 400, 40, 5);

    rect(width - mouseX + 70, 425, 100, 3);
    rect(width - mouseX * 1.5 + 70, 425, 60, 3);
    rect(width - mouseX * 2.5 + 70, 425, 40, 3);
    //makes text follow mouse
    text("stop following me! :((", mouseX, mouseY);
    translate(mouseX, mouseY);
    noStroke();
    //if mouse isn't clicked, text and circles will show
    if (mouseIsPressed === false) {
        fill(0, 0, 255);
        ellipse(20, 20, 20, 20);
        ellipse(40, 40, 20, 20);
        textFont('Courier New');
        fill(255, 0, 0);
        text("no no no no no", 50, 100);
        stroke(255, 54, 258);
        fill(0, 0, 255);
    }
}
//inverses black and white colors when key pressed
function keyTyped() {
    if (defaultBG > 0) {
        defaultBG = 0;
        whiteLines = 255;
    }else {
        defaultBG += 255;
        whiteLines -= 255;
        fill(defaultBG);
    }
}
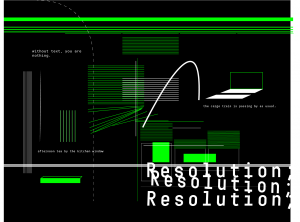
Like many other people, I initially had no idea what to do since it was so open ended. I started off by making random shapes and lines, and since I naturally prefer certain colors, what I made began to resemble this (shown below!) I made for fun last week. This project ended up being a continuation and exploration of that. Since I am interested in bringing narrative elements to everything I made, I created a mini dialogue that results from mouse interaction.