Project-07-Curves-Veronica

sketch

/*
Veronica Wang
Section B
yiruiw@andrew.cmu.edu
Project 07
*/

var nPoints = 100;


function setup() {
    createCanvas(480, 480);
    frameRate(10);
}


function draw() {
    background(255);
   
    // draw the curves
    push();
    translate(width / 2, height / 2);
    drawEpitrochoidCurve();
    drawHypotrocoidCurve();
    pop();


}

//--------------------------------------------------
function drawEpitrochoidCurve() {
    // Epicycloid:
    // http://mathworld.wolfram.com/Epicycloid.html
    
    var x;
    var y;
    
    var a = 60.0;
    var b = a / 3.0;
    var h = constrain(mouseY / 2, 0, width / 5);
    var ph = mouseX / 50.0;
    
    noFill();
    stroke('red');
    strokeWeight(3);
    beginShape();
    for (var i = 0; i < nPoints; i++) {
        var t = map(i, 0, nPoints, 0, TWO_PI);
        
        x = (a + b) * cos(t) - h * cos(ph + t * (a + b) / b);
        y = (a + b) * sin(t) - h * sin(ph + t * (a + b) / b);
        vertex(x, y);
    }
    endShape(CLOSE);  
}

function drawHypotrocoidCurve(){
    //Hypocycloid
    //http://mathworld.wolfram.com/Hypotrochoid.html
    var x;
    var y;

    var a1 = 200;
    var b1 = a1 / 3.0;
    var h1 = constrain(mouseY / 2, 0, width / 5);
    var ph1 = mouseX / 10.0;

    noFill();
    stroke('red');
    strokeWeight(3);

    beginShape();
    for (var i = 0; i < nPoints; i++) {
        var t = map(i, 0, nPoints, 0, TWO_PI);
        
        x = (a1 - b1) * cos(t) + h1 * cos((ph1 + (a1 - b1) / b1) * t);
        y = (a1 - b1) * sin(t) - h1 * sin((ph1 + (a1 - b1) / b1) * t);
        vertex(x, y);
    };
    endShape(CLOSE);
}


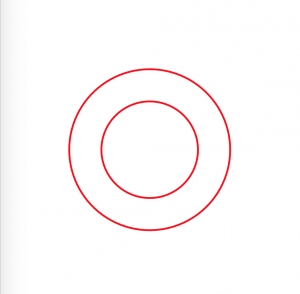
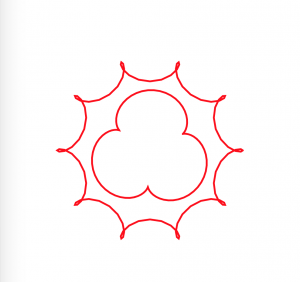
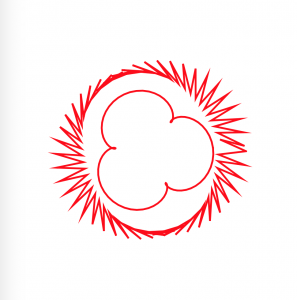
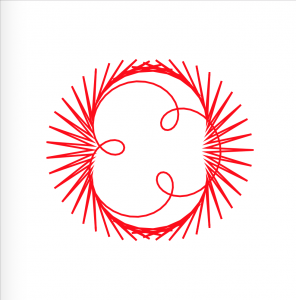
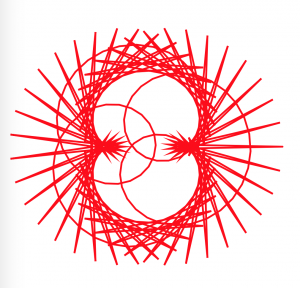
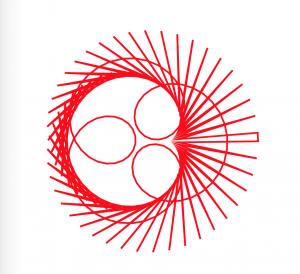
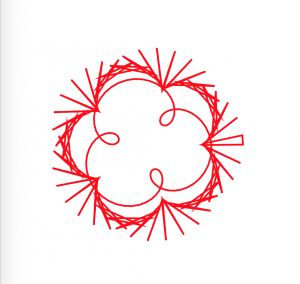
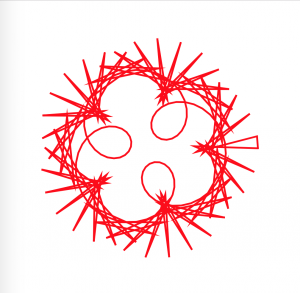
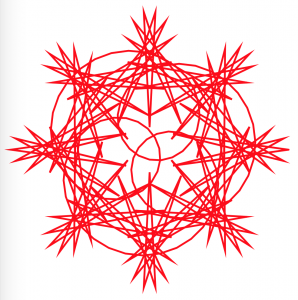
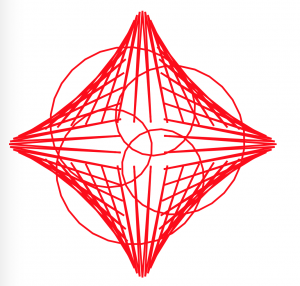
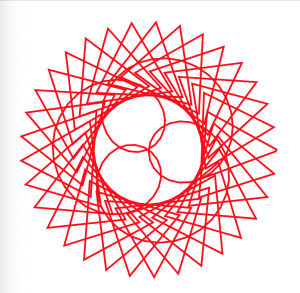
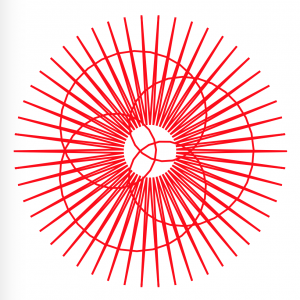
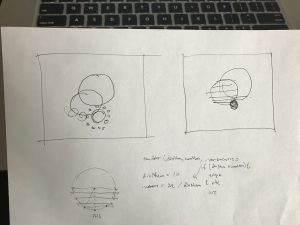
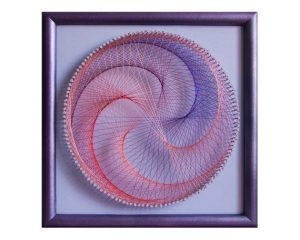
In this project, I used both the hypotrochoid and epitrochoid curves to create interesting compositions. I played around with the amplitude, divisions, diameters, etc of the curve functions. I think it’s interesting how sometimes the animation can sort of explain how the hypotrochoids were generated-when you can see a straight line rotating at the ‘beginning’ point.


Looking Outwards-07 Information Visualization-Veronica Wang

Impact of sporting events on the local economy in Hammersmith and Fulham from Habidatum on Vimeo.

I’ve always been following and interested in Habidatum’s works. They are a data analytics and consulting group that combines multiple layers of GIS data and visualize them in a custom software called Chronotope. They provide simple and easy to understand graphics to convey space-time data and their works had been applied to architecture, master planning, financial, transportation and many other fields. They believe that “by transforming contemporary planning strategies into data-driven adaptive policies, cities and businesses can generate savings, profits and opportunities.”

I think their work is incredible in how it helps the audience grasp multiple layers of data in a straightforward way, and how they can help their clients make informed decisions of their investments that can affect the city’s urban fabric.

Barcelona Tourism and Tweets


Project-06-Abstract Clock-Veronica

sketch

/*
Veronica Wang
Section B
yiruiw@andrew.cmu.edu
Project 06
*/

var prevSec;
var millisRolloverTime;

function setup() {
    createCanvas(600, 600);
    millisRolloverTime = 0;
}

function draw() {
    background(30);
    
    // Fetch the current time
    var H = hour();
    var M = minute();
    var S = second();
    
    // Reckon the current millisecond, 
    // particularly if the second has rolled over.
    if (prevSec != S) {
        millisRolloverTime = millis();
    }
    prevSec = S;
    var mils = floor(millis() - millisRolloverTime);
  
    //text label of time  
    noStroke();
    fill('white');
    text("Hour: "   + H, 10, 22);
    text("Minute: " + M, 10, 42);
    text("Second: " + S, 10, 62);
    text("Millis: " + mils, 10, 82);

    
    //hour ellipse and arc
    stroke('gold');
    var hourR = 150;
    var color = 'gold';
    fill(30);
    ellipse(width / 3, height / 3, hourR * 2, hourR * 2);
    timefiller(24, H, width/3, height/3, hourR, color);

    //minute ellipse and arc
    stroke('skyblue');
    var minR = 100;
    color = 'skyblue';
    noFill();
    ellipse(width * 0.45, height * 0.5, minR * 2, minR * 2);
    timefiller(60, M, width * 0.45, height * 0.5, minR, color);

    //second ellipse and arc
    stroke('lightblue');
    var secR = 75;
    color = 'lightblue';
    noFill();
    ellipse(width * 0.6, height * 0.6, secR * 2, secR * 2);
    timefiller(60, S, width * 0.6, height * 0.6, secR, color);

    //milli second ellipse and arc
    stroke('white');
    var milR = 50;
    color = 'white';
    noFill();
    ellipse(width * 0.75, height * 0.6, 100, 100);
    timefiller(1000, mils, width * 0.75, height * 0.6, milR, color);
    
    //function to draw arc based on division of circle
    function timefiller(divNum, currNum, x, y, r, color){
        var incr = 2 * PI / (divNum * 2); //divide circle into increments based on time unit
        var pt2 = currNum * incr + PI / 2; //time increment point on circle
        var pt1 = PI / 2 - currNum * incr; //time increment point on circle
        fill(color);
        arc(x, y, 2 * r, 2 * r, pt1, pt2, OPEN); //draw open arc based on current time increment points
        
    }


}

In this project I decided to represent the abstract clock with a series of circles being filled up. I challenged myself to write a new function for drawing those open arcs and it turned out just the way I intended. I had trouble figuring out the increments and correct elements to make the arc with, but it reminded me of the string art project which helped me a lot with this.

idea sketches

Looking Outwards-06 Randomness-Veronica Wang

Airspace Studio – Studio M Architects, Thom Faulders

Airspace Tokyo is a multi-family residence spread over four floors, with two photographic studios located on the first and second floor. The exterior screen facade design expresses an almost non-existent distinction between interior and exterior. Designed by Thom Faulders, the screen is capable of giving the structure its own architectural identity and at the same time acting as an urban interface in a neighborhood of row houses. The façade pattern is inspired by the previous vine patterns growing over the walls, and the designer reproduced the ‘random’ pattern of the vegetation through computer programming and repetition of modules.

closeup shot at the double layered facade screen

“The result – explain the authors of the project – translates into a reticular structure that gives shape to a transitory interstitial space between public and private, where the view changes every time you move, the rain does not reach the road by capillary action, the light is refracted on the shiny metallic surface”

Project-05-Wallpaper-Veronica

sketch

/*
Veronica Wang
Section B
yiruiw@andrew.cmu.edu
Project-05
*/

function setup() {
    createCanvas(600, 780);
    background('pink');   

    var tw = 50; // x spacing
    var th = 50; // y spacing
    var newTh = th * sqrt(3) / 2; // new y spacing

    var ang = radians(60); //radians to degrees
    var offset = tw / 2; // new x shift

    
    var ox = 0; // ellipse center y
    var oy = 0; // ellipse center x
    var num = 10; //elements per row

    for (var y = 0; y < 80; y++) {
        
        //if its an even number row, have one less element
        if (y % 2 == 1){
            var z = offset;
            num = 20;
        }
        //if its an odd number row draw all elements
        else{
            var z = 0;
            num = 20;
        }

        //draw circle grid
        for (var x = 0; x < num; x++) {

            var py = oy + y * newTh;
            var px = ox + x * tw + z;
    
            noFill();
            stroke('white');
            ellipse(px - 50, py, 100, 100);
            fill('white');
            ellipse(px - 50, py, 10, 10);
            stroke(5);
            strokeWeight(2.5);
         
        }


    }
    noLoop();
}


function draw() {
    // draw is not called due to noLoop() in setup()
}

In this assignment I was inspired by Japanese origami paper patterns and decided to play with repeated patterns of simple geometry.

I altered the hex grid code so that the circles start overlapping and then I added nodes to the connection points. I am happy with the result and wouldn’t mind using this as a wallpaper in my room.

Looking Outwards-05 3D Computer Graphics-Veronica Wang

ALOHA Illustration
BRAH Illustration


This is a project by Saatchi & Saatchi IS in Poland. It’s a series of advertising/branding illustrations for Nobile Sports in Poland, and the dotted line in each image represents the pattern on their surfboards. I think it’s a clever idea and the graphics of the miniature scenes were very nice.

Clay Render

The illustrations were done using Cinema4D, and they modeled each element in the software for rendering and color is added later on.

Marketing Image

https://www.behance.net/gallery/51225177/Nobile

Project-04-String-Art-Veronica

sketch

/*
Veronica Wang
Section B
yiruiw@andrew.cmu.edu
Project-04
*/

var r = 125; //radius of circle
var inc = 100; //increments on the circle
var stepDif = inc;//each step increases one increment
var stepNum = 0;//step number count


function setup() {
    createCanvas(400, 300);
    background(0);
}

function draw() {

    var centerX = width / 2; //center x of circle
    var centerY = height / 2; //center y of circle
    var step = 2 * PI / inc; //increment size

    //main ellipse to be divided
    stroke(120);
    strokeWeight(0.5);
    noFill();
    ellipse(centerX, centerY, r * 2, r * 2);
    

    for (i = 0; i < inc / 2; i += 1){
        var currNum = stepNum; //current iteration number
        //x and y coordinates of starting points equally divided increments along ellipse
        var x1 = centerX + r * cos(step * currNum); 
        var y1 = centerY - r * sin(step * currNum);
        //for every increment in starting point,
        //step two increaments for destination point 
        var nextNum = (inc / 2 + 2 * (currNum)) % inc; 
        //x and y coordinates of the destination points on the ellipse
        var x2 = centerX + r * cos(step * nextNum);
        var y2 = centerY - r * sin(step * nextNum);
        //step number increase
        stepNum += 1;
        stroke(220, 20, 60);
        line(x1, y1, x2, y2);
    }

    var offset = 0; //offset to create layers
    var repeats = 7; //how many layers
    var op = 100; //opacity of layer color to create depth

    for (i = 0; i < repeats; i += 1) {
        op -= i * 4; //opacity decrease
        stepNum = 0; //step number
        offset += 8; //offset by 8 increments each time
        
        //same as the for loop above
        for (j = 0; j < inc / 2; j += 1){ 
            var currNum = stepNum + offset;
            var x1 = centerX + r * cos(step * currNum);
            var y1 = centerY - r * sin(step * currNum);
            var nextNum = ((inc / 2 + 2 * (currNum - offset)) + offset) % inc;
            var x2 = centerX + r * cos(step * nextNum);
            var y2 = centerY - r * sin(step * nextNum);
            stepNum += 1;
            stroke(220, 20, 60, op);
            line(x1, y1, x2, y2);
        }
    }

    noLoop();

}

In this project I looked up string art and found inspiration from Demir String art. I decided to make a project similar to this art piece they made:

It took me some time to figure out how to extract points from a circle, as well as stepping in different increments for the two ends of a line. But I am happy with the output and had fun doing this project.

Looking Outwards-04 Sound Art-Veronica Wang

CARBONSCAPE, the latest kinetic data soundscape installation by h0nh1m aka chris cheung from designboom on Vimeo.

CarbonScape is a kinetic soundscape installation created by Chris Cheung. It consists of 18 tracks of granular synthesized sound samples. They are collected from the sound sources where carbon footprints left: the sound from the jet engine, steam from the factory and horn of the ship, etc… The finale is composed of all tracks blending into the soundscape.

Interactive installation

The installation is a visualization of CO2 levels arranged in a bamboo forest like landscape, with the changing ambiance drone noises, imitates chimneys frequently found in power plants and factories, with black spheres indicating CO2 levels around the globe.

Sound data incorporated with the exhibition

Project-03-Dynamic-Drawing-Veronica

sketch


/*
Veronica Wang
Section B
yiruiw@andrew.cmu.edu
Project-03
*/

var r1 = 100; //size of ellipse 1
var r2 = 80; //size of ellipse 2
var r3 = 120; //size of ellipse 3
var locX = 200; //rotation center of ellipses
var locY = 250; //rotation center of ellipses
var angle = 1; //first angle of rotation
var angle2 = 1; //second angle of rotation
var angle3 = 1; //third angle of rotation
var angle4 = 1; //fourth angle of rotation
var on = true; //background color


function setup() {
    createCanvas(640, 480);
}

function draw() {
//change background between black and white    
    if (on == true) {
        background(255);
      } else {
        background(0);
      }

    noStroke();
    //red ellipse
    fill(255, 0, 0, 150);
    ellipse(320, 100, mouseX, mouseX);
    //blue ellipse
    fill(0, 0, 255, 150);
    ellipse(locX,locY, mouseX, mouseX);
    //green ellipse
    fill(0, 255, 0, 150);
    ellipse(400, 450, mouseX, mouseX);

    //magenta ellipse
    push();
    translate(locX, locY);
    rotate(radians(angle));
    noStroke();
    fill(255, 0, 255, 150);
    ellipse(mouseX / 8 + 0.5 , mouseY / 8 + 1, r1 + mouseY / 2, r1 + mouseY / 2);
    pop();
    angle = angle + 1;

    //cyan ellipse
    push();
    translate(locX + 10, locY);    
    noStroke();
    fill(0, 255, 255, 150);
    rotate(radians(angle));
    ellipse(mouseX / 2 + 0.5 , mouseY / 2 + 1, r2 + mouseY / 1.5, r2 + mouseY / 1.5);
    pop();
    angle2 = angle2 + 2;

    //yellow ellipse
    push();
    translate(locX + 50, locY);    
    noStroke();
    fill(255, 255, 0, 150);
    rotate(radians(angle));
    ellipse(mouseX / 5 + 0.5 , mouseY / 6 + 1, r3 + mouseY / 3, r3 + mouseY / 3);
    pop();
    angle3 = angle3 + 0.5;

    //white line
    push();
    translate(locX, locY + 50);    
    noStroke();
    fill(255, 255, 255, 150);
    rotate(radians(angle));
    rectMode(CENTER);
    rect(mouseX / 5 + 0.5 , mouseY / 6 + 1, 10, 1000);
    pop();
    angle3 = angle3 + 0.5;

    //black line
    push();
    translate(100, 100);    
    noStroke();
    fill(0, 0, 0, 150);
    rotate(radians(angle));
    rectMode(CENTER);
    rect(mouseX / 2 + 0.5 , mouseY / 2 + 1, 20, 1000);
    pop();
    angle4 = angle4 - 1;

    //white line apprears at mouse click
    if (mouseIsPressed) {
        if (mouseButton == LEFT) {
            stroke(255);
            strokeWeight(30);
        } else {
            stroke(0);
        }
        line(0, 200, width, 50);
    }
}

//change background between black and white
function mousePressed() {
  if (on == true) {
    on = false;
  } else {
    on = true;
  }
}

In this project I explored different color models and the relationship between colors. I played around with ellipses of colors red, green, blue, cyan, magenta, and yellow, as well as the overlaps of these colors. The background also changes from white to black.

Looking Outwards-03 Computational Fabrication-Veronica Wang

The Brick Labyrinth is a project done at ETH Zurich’s Architectural department using programming in the design process and robotics fabrication. On their website it is described that「 The Brick Labyrinth is re-visiting one of the most archaic building techniques, dry-stacked brick walls, in a completely new setting…the Master of Advanced Studies used the multi-robotic gantry system in the Robotic Fabrication Laboratory to build a full-scale architectural installation of a brick labyrinth. Students used computational tools not only to iterate through designs but also to check the stability and feasibility of the produced structures and to generate the sequence and commands to control the multi-robotic fabrication of the final structure. 」

Top View of Final Installation
Fabrication in Process
Experiential Capture

I took a robotics centered architectural design studio last semester and we took a lot of inspiration from the ETH program. I am interested in especially how robotics fabrication can aid construction processes and its ability to accurately execute complex designs within a shorter amount of time because of the streamlined process.