Yiran Xuan – Looking Outward 07

This visualization was custom-made by a reddit user with a combination of R, Python, and Javascript and related plugins. The data used was estimated using a combination of U.S. Census data and public transportation inflow/outflow statistics. Using this visualization, we can make analyses about city activity. What I most admire about the project is the work put in to create the population estimates, and the fact that a straightforward visualization method (3D bars) can used to create an image that appears to make the city breath.

https://manpopex.us/

The City is Alive: The Population of Manhattan, Hour-by-Hour [OC] from dataisbeautiful

Yiran Xuan – Project 07 – Curves

The idea behind this project was to implement an “unfolding” of the involute from the surface of the circle, similar to an Asian fan or a wing. A little struggle was had in keeping track of the angle variables, whether they represented angles themselves or just the increments (out of 24).

The mouse in the horizontal direction controls the unfolding, while in the vertical the rotation of the whole drawing is affected.

sketch

//Objective: draw circle involute
//mouse control: y controls the amount of "wrapping"
//mouse control: x controls initial angle

var wrap = 0; //determines how far the involute extends out
var initangle = 0;

var increment = 12;
var radius = 25;

function setup() {
    createCanvas(480, 480);
    angleMode(RADIANS);
}

function draw() {
	translate(width/2, height/2); //shifting coordinates to the center

	rotate(constrain(mouseY, 0, 480)/240*PI); //rotation

    background('white');

	wrap = 24 - constrain(mouseX, 0, 480)/20; //number of increments to go around circle

	noFill();
	strokeWeight(3);
	stroke('orange');
	ellipse(0, 0, radius*2, radius*2); //drawing center circle

	var accumulatedincrement = 0;

	for(var i = 0; i <= wrap; i++){
		stroke('cyan');

		var currentangle = accumulatedincrement/increment*PI;
		var x1 = radius*(cos(currentangle) + currentangle*sin(currentangle)) //determining fan section start point
		var y1 = radius*(sin(currentangle) - currentangle*cos(currentangle));

		accumulatedincrement++;
		
		var nextangle = accumulatedincrement/increment*PI;
		var x2 = radius*(cos(nextangle) + nextangle*sin(nextangle)); //determining fan section end point
		var y2 = radius*(sin(nextangle) - nextangle*cos(nextangle));

		triangle(x1, y1, x2, y2, 0, 0); //drawing triangle

		stroke('red');
		line(x1, y1, radius*cos(nextangle), radius*sin(nextangle)); //drawing lines to display tangency
	}

}

Yiran Xuan – Project 06 – Abstract Clock

I started with the idea of a water dripping, at first wanting to just have a series of pitchers pouring into each other. However, this seemed rather uninteresting, and also the mechanics of the water pouring seemed to complicated. I thought it would be better to display each time unit differently, so I went with a plant growing in front of a changing sky.

sketch


var currentsec = second();
var dropdistance = 200;

var totalminutes = hour()*60 + minute();
var sunlight;

var waterlevel = 0;

function setup() {
    createCanvas(300, 300);
    angleMode(DEGREES);
    
}

function draw(){
	totalminutes = hour()*60 + minute();
	sunlight = round(abs(totalminutes/3 - 240)); //ensures that sunlight value is greatest when totalminutes is half of the midnight value

	background(120 - sunlight/2, 240 - sunlight, 240 - sunlight) //background changes gradually each minute; is darkest in the evening and early morning, lightest during the day
	
	
	if(currentsec != second()){ //if start of a new second, create droplet at top of canvas
		dropdistance = 0;
	}
	else {
		dropdistance += 5; //allow droplet to fall
	}

	currentsec = second();

	waterlevel = second();

	noStroke()
	fill(0, 255, 255);
	ellipse(100, dropdistance, 6, 6); //draw droplet
	rect(0, 300 - (waterlevel/2), 300, waterlevel/2); //draw water at the bottom


	stroke('green');
	strokeWeight(7);
	var plantheight = 270 - minute()*4;
	line(120, 300 - (waterlevel/2), 120, plantheight); //draw plant stalk

	noStroke();
	fill('green'); //draw plant leaves
	triangle(120, plantheight, 120 - 15, plantheight - 20, 120 - 40, plantheight - 10);
	triangle(120, plantheight, 120 + 15, plantheight - 20, 120 + 40, plantheight - 10);


}

Yiran Xuan – Looking Outwards – 05

Archaeology is a prime application for 3D computer graphics. Due to technology, we have been able to discover more and more archaeological artifacts that were previously unknown or inaccessible; however, access and exposure to these artifacts, or simply the march of industrial development, have also put some of them at risk. Old buildings and statues in Europe are damaged by acid rain, sections of the Great Wall of China are swallowed by encroaching desertification, and the giant Buddhas in Afghanistan are being destroyed. A solution to their preservation is to use laser scanning to create a virtual 3D model of the site. This can create an accurate record of the artifact before its possible degradation, or help in the restoration of certain parts. It is also powerful tool to allow researchers to study the artifact in ways that are physically impossible, such as manipulating the models, seeing them from a different view, or just accessing them without having to travel.

Yiran Xuan – Project 05 – Wallpaper


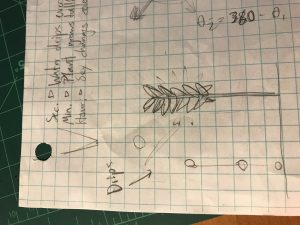
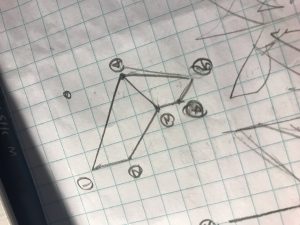
To generate the wallpaper, I first drew a pattern on graph paper, labelling the number of points and the connections that would need to be made between them. Then I realized that I would need 3 nested loops to draw this pattern with the most efficiently; outermost loop to iterate through the rows, next loop to iterate through each butterfly, and innermost loop to iterate through each line. I used arrays to store the coordinates of the points. I also wanted butterflies to alternate orientation with their horizontal and vertical neighbors, necessitating two variables to keep track of orientation.

sketch

function setup() {
    createCanvas(400, 600);
    background('grey');
    
    var xdist = 32; //horizontal distance between iteration
    var ydist = 24; //vertical distnace between iteration

    var xcoord = [16, 16, 8, 0, 4, 8, 8]; //x coordinates for butterfly
    var ycoord = [12, 4, -4, 0, -12, -8, -4]; //y coordinates for butterfly

    
    var firstdir = 1; //orientation of the pattern at the beginning of the row
	var dir = -1; //determines orientation of butterfly

	//strokeWeight(4);
	

	//line(32 + xcoord[1], 24 + dir*ycoord[1], 32 + xcoord[1+1], 24 + dir*ycoord[1+1]);

	
    for(var i = 12; i <= height; i += ydist ){ //one iteration is one row
    	dir = firstdir;	//sets first orientation

    	for(var j = 16; j <= width; j+= xdist){ //one iteration is one pattern
    		stroke(127 + dir*127);

    		for (var k = 0; k < xcoord.length; k++){ //one iteration is two lines, mirrored
    			line(j + xcoord[k], i + dir*ycoord[k], j + xcoord[k+1], i + dir*ycoord[k+1]);
    			line(j - xcoord[k], i + dir*ycoord[k], j - xcoord[k+1], i + dir*ycoord[k+1]);
    			}
    			//line(j + xcoord[3], i + dir*ycoord[3], j + xcoord[6], i + dir*ycoord[6]); //missing lines whoops
    			//line(j - xcoord[3], i + dir*ycoord[3], j - xcoord[6], i + dir*ycoord[6]); //missing lines whoops
    			line(j + xcoord[0], i + dir*ycoord[0], j + xcoord[3], i + dir*ycoord[3]); //missing lines whoops
    			line(j - xcoord[0], i + dir*ycoord[0], j - xcoord[3], i + dir*ycoord[3]); //missing lines whoops

    		dir = -dir; //flips direction so pattern alternates
    	}

    	firstdir = -firstdir; //flips first orientation so next row alternates
    }
    
    noLoop();

    
}

function draw() {
}

Yiran Xuan – LookingOutwards – 04

Robots can play instruments now; automatons have had the ability to do so for hundreds of years. And they can read music too; combine a scanning software with reading software, and a robot can interpret sheet music on a stand. Together, with a consistent internal tempo, instant communication, robots could be the perfect orchestral musician…if they could be led by a conductor.

Interpreting a conductor presents a few challenges and decisions. First, is how to detect the motions? Computer vision or accelerators? Also, what universal motions between many different conducting styles communicate a timing, an volume, or an emotion? Musicians, when being conducted, usually anticipate a move on part of the conductor; would robots be able to do the same? Musicians also try to keep a consistent internal tempo according to the sheet music, and adjust to the conductor once the motions become evident. Would robots be able to adjust similarly?

A similar project focused around building a program to detect and correct conducting form: https://drive.google.com/file/d/1DDeeQezbasnELFeGOyKGwGF2jq_IXTDG/view?usp=sharing

YiranXuan-Project04-String-Art

This string art is based on an physical string art example I found on the web that is similar to the yin-yang. At first I was curious what the mathematical formula would be to create such a pattern where the inner curve would curve much more sharply than the outer curve. This was explained when I watched the video, where the artist increments one side of the strings by two pegs around the circle, while the other side only by one peg. I also needed to solve the problem of overlapping; I wanted both colors to be cover each other only in specific areas, not just have one over the other. This was solved by drawing strings for both sides in the same loop iteration.

sketch

function setup() {
    createCanvas(400, 300);
    background('white');
    angleMode(DEGREES);
}

function draw() {
	var radius = 150;
	var dotradius = 50;

	var whitecenter = 210; //centers of the dots
	var blackcenter = 90;

	var whiteslow = 0; //each line consists of a "slow point" that travels around the circle at 1 degree per iteration
	var whitefast = 180; //and a "fast point" which travels around the circle at 2 degrees per iteration;
	var blackslow = 180;
	var blackfast = 0;

	//the dots will piggyback off of the progression of whitefast, as they are forming complete circles. 
	//They will beformed by lines that are offset by 15 degrees

	var slowincrement = 3;
	var fastincrement = 2*slowincrement;

	for(whiteslow = 0; whiteslow <= 180; whiteslow += slowincrement){

		stroke('red');
		line(cos(whitefast)*dotradius + width/2, sin(whitefast)*dotradius + whitecenter, cos((whitefast+120)%360)*dotradius + width/2, sin((whitefast+120)%360)*dotradius + whitecenter); //drawing the white dot
		stroke('blue');
		line(cos(whitefast)*dotradius + width/2, sin(whitefast)*dotradius + blackcenter, cos((whitefast+120)%360)*dotradius + width/2, sin((whitefast+120)%360)*dotradius + blackcenter); //drawing the white dot


		stroke('red');
		line(cos(whiteslow)*radius + width/2, sin(whiteslow)*radius + height/2, cos(whitefast)*radius + width/2, sin(whitefast)*radius + height/2); //drawing the first white line
		stroke('blue');
		line(cos(blackslow)*radius + width/2, sin(blackslow)*radius + height/2, cos(blackfast)*radius + width/2, sin(blackfast)*radius + height/2); //drawing the first black line
		//the updated slow points to the old fast points

		blackfast = (blackfast+fastincrement)%360; //updating fast points; if they go over 360, they wind back at 1
		whitefast = (whitefast+fastincrement)%360;

		stroke('yellow');
		line(cos(whiteslow)*radius + width/2, sin(whiteslow)*radius + height/2, cos(whitefast)*radius + width/2, sin(whitefast)*radius + height/2); //drawing the first white line
		stroke('cyan');
		line(cos(blackslow)*radius + width/2, sin(blackslow)*radius + height/2, cos(blackfast)*radius + width/2, sin(blackfast)*radius + height/2); //drawing the first black line
		//the updated slow points to the updated fast points

		blackslow += slowincrement; //updating slow point
	}

}


Project-03-Dynamic-Drawing

My initial idea was a sort of a compass or star that would rotate to always face the mouse. This was easiest as having the circle be in set positions, but grow when the mouse hovers close. I then had the idea to incorporate the “getting warmer” scheme, so that the circles would transition from one color to another as the mouse comes closer. Having 12 circles, this required extensive use of loops and arrays.

sketch


var centerx = 640/2;
var centery = 480/2;
var radius = 175;

var d = [1, 1, 1, 1, 1, 1, 1, 1, 1, 1, 1, 1];
var angles = [0, 30, 60, 90, 120, 150, 180, 210, 240, 270, 300, 330];

var largest = 0;
var trianglewidth = 50;

function setup() {
    createCanvas(640, 480);
    angleMode(DEGREES);
}

function draw() {
	background('white');
	noStroke();

	for(i = 0; i < d.length; i++){
		d[i] = (255 - dist(centerx + cos(angles[i])*radius, centery + sin(angles[i])*radius, mouseX, mouseY)) / 3;

		if (d[i] < 0){
			d[i] = 0;
		}

		if (d[i] > d[largest]){
			largest = i;
		}

		fill(255 - d[i]*3, 0, d[i]*3);
		ellipse(centerx + cos(angles[i])*radius, centery + sin(angles[i])*radius, d[i], d[i]);
	
	}
	var linecolor = dist(centerx, centery, mouseX, mouseY);
	if(linecolor > 255){
		linecolor = 255;
	}
	stroke(linecolor);
	strokeWeight(4);
	line(centerx, centery, centerx + cos(angles[largest])*(radius - d[largest]/2), centery + sin(angles[largest])*(radius - d[largest]/2));

}

Yiran Xuan – Looking Outwards – 02

Minecraft  is probably one of the most well-known and well-experienced examples of generative art. A terrain generated by its algorithm can grow until it can fit the entirety of your computer’s hard drive, which is easily greater than the surface area of our planet. Each new section generated is also unique; though they follow easily understood patterns and rules, every generated section is a new area for exploration, with a random distribution of resources and dangers. The idea is to emulate the natural world, and despite the distinctive blocky graphic style, the feel of a natural world created out of fundamental forces is achieved.

Yiran Xuan Project-02-Variable-Face

This sketch was made by adapting the template. The rectangular face and many other elements are centered on the canvas by frequent use of the canvas dimensions (stored as variables) divided by half, in the shape parameters.

sketch


var noseheight = 150
var nosewidth = 50;

var facewidth = 200;
var faceheight = 150;

var eyesize = 20;
var eyedistance = 100;

var eyecolor = 0;

var canvasheight = 640;
var canvaswidth = 480;

function setup() {
    createCanvas(canvaswidth, canvasheight );
}

function draw() {
    background(180);

    fill(100);
    //draw the face;
    rect((canvaswidth-facewidth)/2, (canvasheight-faceheight)/2, facewidth, faceheight);
    //draw the eyes
    fill(eyecolor);
    ellipse((canvaswidth - eyedistance)/2, 300, eyesize, eyesize);
    ellipse((canvaswidth + eyedistance)/2, 300, eyesize, eyesize);
 	//draw the nose
 	fill(100);
 	triangle((canvaswidth - nosewidth)/2, canvasheight/2, (canvaswidth + nosewidth)/2, canvasheight/2, canvaswidth/2, noseheight);
 	//draw the mouth

 	line(canvaswidth/2-50, (canvasheight+faceheight)/2 - 50, canvaswidth/2+50, (canvasheight+faceheight)/2 - 50);
}	

function mousePressed() {
    // when the user clicks, these variables are reassigned
    // to random values within specified ranges. For example,
    // 'faceWidth' gets a random value between 75 and 150.
    eyecolor = random(0, 255);

    eyesize = random(10, 30);
    eyedistance = random(75, 125);

    nosewidth = random(30, 70);
    noseheight = random(canvasheight/2 - 20, canvasheight/2 + 20);
}