Tanvi Harkare – Project 07 – Curves

sketch

/*Tanvi Harkare
Section B
tharkare@andrew.cmu.edu
Project-07 */

var numLines = 20;
var angle = 0;
var angleX;
var clickCount = 1;
var circleW;
var circleC;

function setup() {  
    createCanvas(480, 480);
}

function draw() {
    background(0);
    for(var i = 0; i < numLines; i++){
        noFill();
        strokeWeight(clickCount);
        push();
        angleX = map(mouseX, 0, 480, 0, 90); //altering how slow or fast ellipses rotate 
        circleC = map(mouseX, 0, 480, 20, 255); //altering stroke color from black to white
        numLines = map(mouseY, 0, 480, 5, 50); // altering amount of lines drawn
        circleW = map(mouseY, 0, 480, 200, 50); //altering ellipse width
        stroke(circleC);
        translate(width / 2, height / 2);
        rotate(radians(angle));
        ellipseMode(CENTER);
        ellipse(0, 0, circleW, 400);
        pop();
        angle += angleX;

    }
}

function mouseClicked(){
    //increases strokeWeight parameter based on mouse clicks
    clickCount++;
}

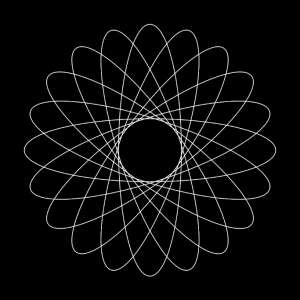
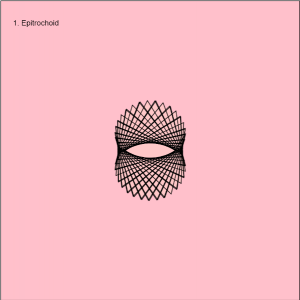
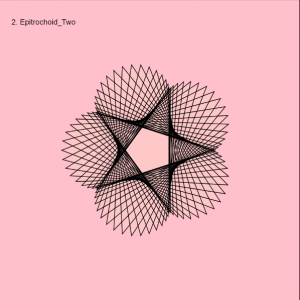
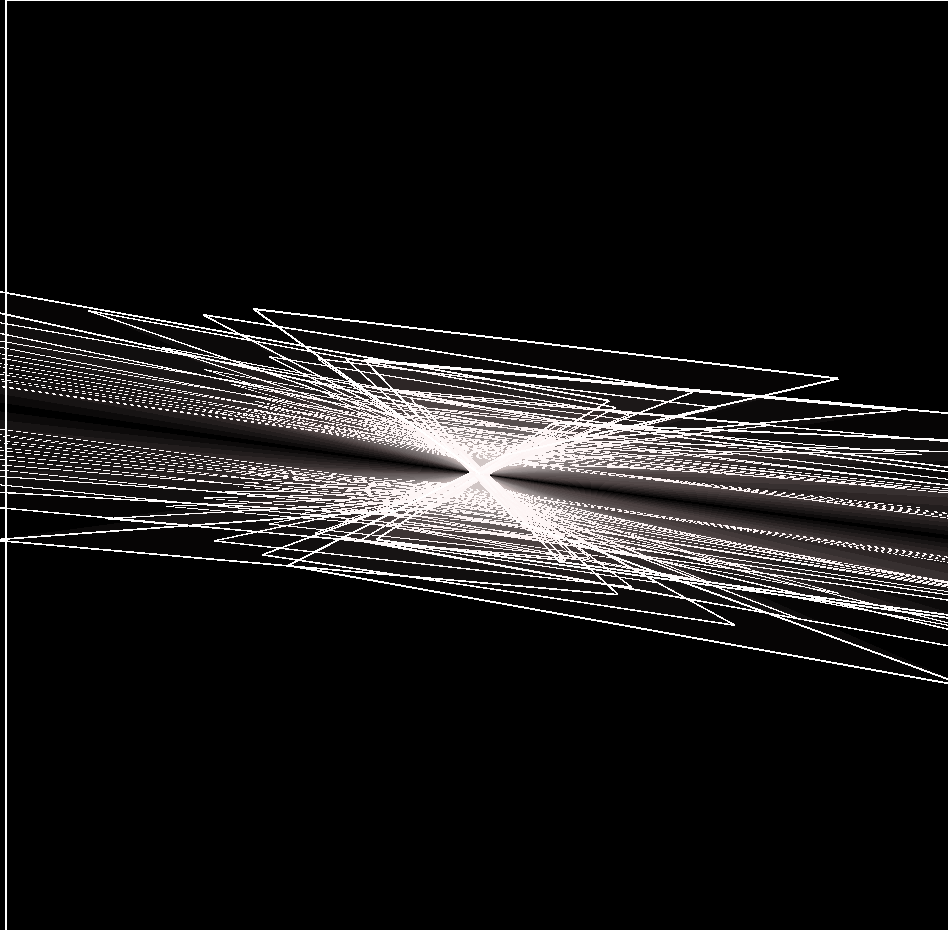
function keyPressed() {
    clickCount = 1;
}

For this project, I was inspired by the spirograph curves. I created a set of ellipses that change based on mouseX and mouseY parameters. The mouseX changes the color of the stroke and the angle of rotation for the ellipses. The mouseY changes how many curves are drawn and the width of the curves. Additionally, when the mouse is clicked the strokeWeight will increase. When any key is pressed, the strokeWeight defaults back to its original value.

Screenshot of an example of how ellipses would look if it were not interactive

Judy Li-Project-07-Curves

judyli: Curve Project 07

/*
Judy Li
Section A
judyli@andrew.cmu.edu
Project-07
*/

var nPoints = 100;
var EPITROCHOID = 0; // Cartesian Parametric Form  [x=f(t), y=g(t)]
var EPITROCHOIDTWO = 1; // Cartesian Parametric Form  [x=f(t), y=g(t)]

var titles = ["1. Epitrochoid", "2. Epitrochoid_Two"];
var curveMode = EPITROCHOID;


function setup() {
    createCanvas(480, 480);
}


function draw() {
    background("pink");
    
    // draw the frame
    fill(0); 
    noStroke();
    text(titles[curveMode], 20, 40);
    stroke(0);
    noFill(); 
    rect(0, 0, width-1, height-1); 
    
    // draw the curve
    push();
    translate(width / 2, height / 2);
    switch (curveMode) {
    case EPITROCHOID:
        drawEpitrochoidCurve();
        break;
    case EPITROCHOIDTWO:
        drawEpitrochoidTwo();
        break;
    }
    pop();
}

//--------------------------------------------------
function drawEpitrochoidCurve() {
    // Circle Orthotomic:
    // http://mathworld.wolfram.com/Epicycloid.html
    
    var x;
    var y;
    var a = 40.0;
    var b = 20;
    var ph = mouseX / 10.0;
    
    fill(255, 200, 200);
    beginShape();
    for (var i = 0; i < nPoints; i++) {
        var t = map(i, 0, nPoints, 0, TWO_PI);
        x = ((a + b) * (cos(ph * t))) - (b* cos(((a + b) / b) * (ph * t)));
        y = ((a + b) * (sin(ph * t))) - (b* sin(((a + b) / b) * (ph * t)));
        vertex(x, y);
    }
    endShape(CLOSE);
    
}

//--------------------------------------------------
function drawEpitrochoidTwo() {
    // Circle Orthotomic:
    // http://mathworld.wolfram.com/Epicycloid.html
    
    var x;
    var y;
    var a = 100.0;
    var b = 20;
    var ph = mouseX / 20.0;
    
    fill(255, 200, 200);
    beginShape();
    for (var i = 0; i < nPoints; i++) {
        var t = map(i, 0, nPoints, 0, TWO_PI);
        x = ((a + b) * (cos(ph * t))) - (b* cos(((a + b) / b) * (ph * t)));
        y = ((a + b) * (sin(ph * t))) - (b* sin(((a + b) / b) * (ph * t)));
        vertex(x, y);
    }
    endShape(CLOSE);
    
}

//--------------------------------------------------
function mousePressed() {
    curveMode = 1 - curveMode;
}

This project was a little bit challenging at first because I wasn’t sure which curve to choose and introduce it to the given code example. In the end, I choose to go with the epitrochoid curve because it resembles a shape I like and it’s almost like a flower/star. I like this curve because it seems like it’s being weaved into a different shape as you move your mouse from left to right. For this project, I included the two curves I liked the most, the asymmetrical shaped one, which looks like asymmetric reproduction and the other one with 5 outer petals/vertices.

Epitrochoid Curve: Link to curve

Curve 01
Curve 02


Min Jun Kim- Project 7 Curves

Try clicking and dragging!
sketch

/*
Min Jun Kim
minjunki@andrew.cmu.edu
15104-B
Project 7
*/

//This project draws a 3D model of spherial spiral

//how many points there are
var nPoints = 500;
//used for dragging
var dragging = false;

function setup() {
    createCanvas(480, 480, WEBGL);
    frameRate(100);
}


function draw() {
    background(0);
    // draw the frame
    stroke(255);
    noFill(); 
    rect(-width/2+3, -height/2+3, width-6, height-6); 
    //a circle that follows the mouse
    ellipse(mouseX-width/2,mouseY-height/2, 50,50);


    // draws the curve
    push();
    //rotate on z axis automatically, rotate x and y when clicked
    rotateZ(millis() / 8000);
    if (dragging == true) {
    	rotateX((mouseX-width/2) / 500);
	    rotateY((mouseY-height/2) / 500);
    }
    //calls drawing function.
    drawSphericalSpiral();
    pop();
}

//--------------------------------------------------
function drawSphericalSpiral() {
    // Spherical Spiral
    // http://mathworld.wolfram.com/SphericalSpiral.html
    //initialize points
    var x;
    var y;
    var z;
    //complexity depends on mouse
    var ph = mouseX / 10000.0;
    stroke(255);
    //transparent fill
    fill(255, 200, 200,3);
    beginShape();
    for (var i = 0; i < nPoints; i++) {
        var t = map(i, 0, nPoints, 0, TWO_PI);        
        x = 80*cos(i)/Math.pow(1+ph*ph*t*t,1/2);
        y = 80*sin(i)/Math.pow(1+ph*ph*t*t,1/2);
        z = 80*-ph*i/Math.pow(1+ph*ph*t*t,1/2);
        vertex(x, y, z);
    }
    endShape(CLOSE);
 	
}

function mousePressed() {
	dragging = true;
}

function mouseReleased() {
	dragging = false;
}

At first, I didn’t quite understand how to use mathematical functions to draw, but after messing around with the vertices, I learned the basics of it. I messed around with various functions, but I wanted to use a more complex curve. I then tried to implement a 3D function and the one that I liked the most was a spherical spiral. I thought that the shape was interesting in the drawings I found online. I realized that it doesn’t look exactly like that image I found online, which can possibly partly be attributed to the lack of negative values available in the functions, but I think that it still looks very interesting. The constant rotation made me dizzy so I implemented a dragging function so that it looks much simpler from one side. From the z axis, it looked like a regular circle so I made the coloring of it more transparent so that the planes are more see-through. I think the project turned out great and it taught me a lot about how to draw in javascript.

Here are some iterations where I was messing around with the numbers and variables in the function.

Process documentation 1.
Process documentation 2.