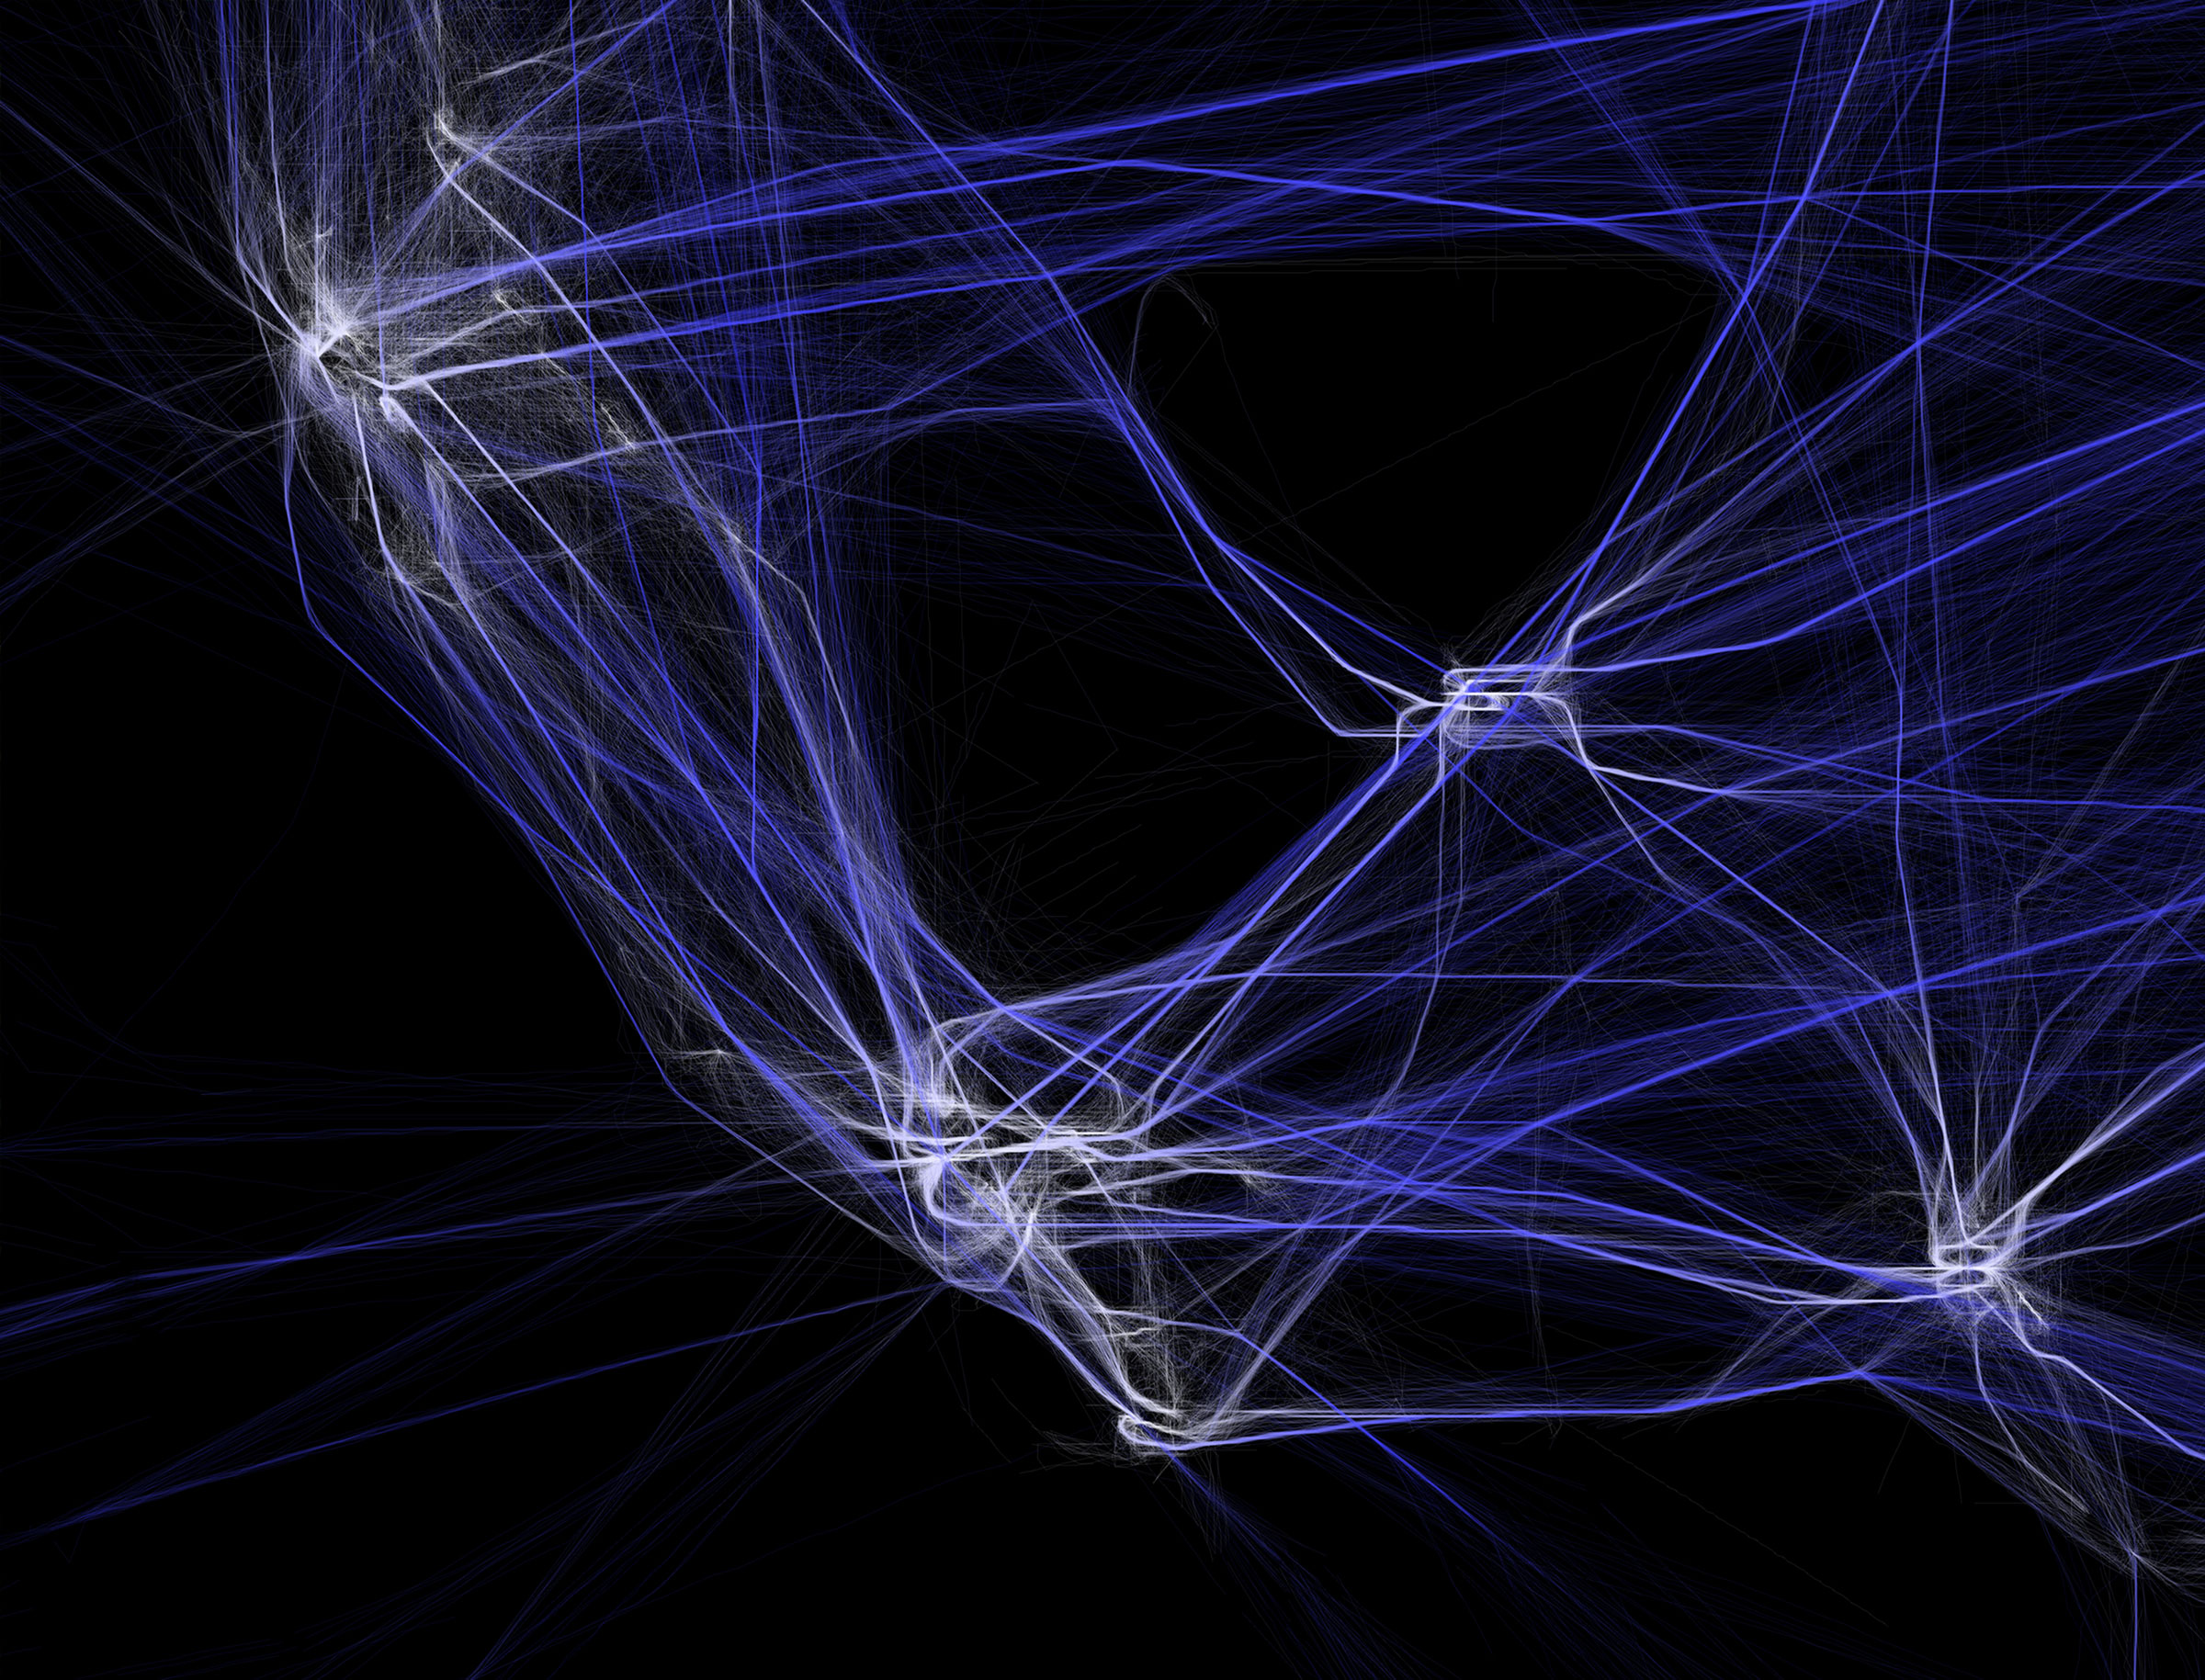
The project above is called “Flight Patterns” by Aaron Koblin. It is a graphical visualization which uses a software to represent flight patterns and routes running across America through representational means of form variation and color. Koblin developed the project as part of a larger study called “Celestial Mechanics” in partnership with two other scientists at UCLA. According to Koblin’s website, the project leaders took FAA data of flight patterns and parsed it using an algorithm. The parsed data was then processed using another program and visually edited with software such as Maya and Adobe AfterEffects.
I like this projects interest in utilizing a data set like flight patterns and turning it into a very interesting and compelling visual graphic. I think the author’s original intent in creating the graphic was recognized as they wanted to study celestial data and represent it.

![[OLD FALL 2019] 15-104 • Introduction to Computing for Creative Practice](../../../../wp-content/uploads/2020/08/stop-banner.png)